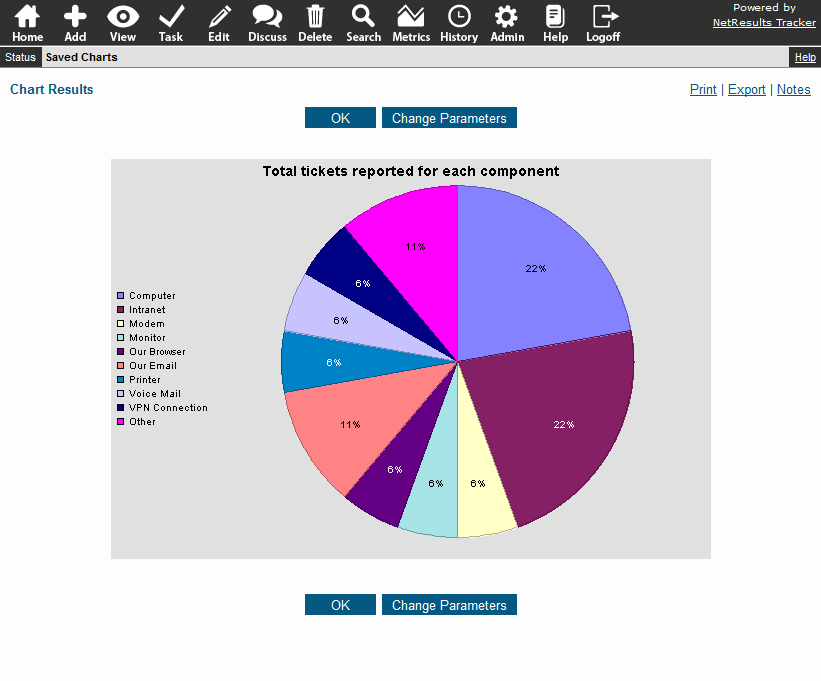
Run a chart that shows you how many tickets were reported against each component.
Charts have the option to show a calculation for each value in a pulldown field. You can even break down the data by a second pulldown like Sub-Component.
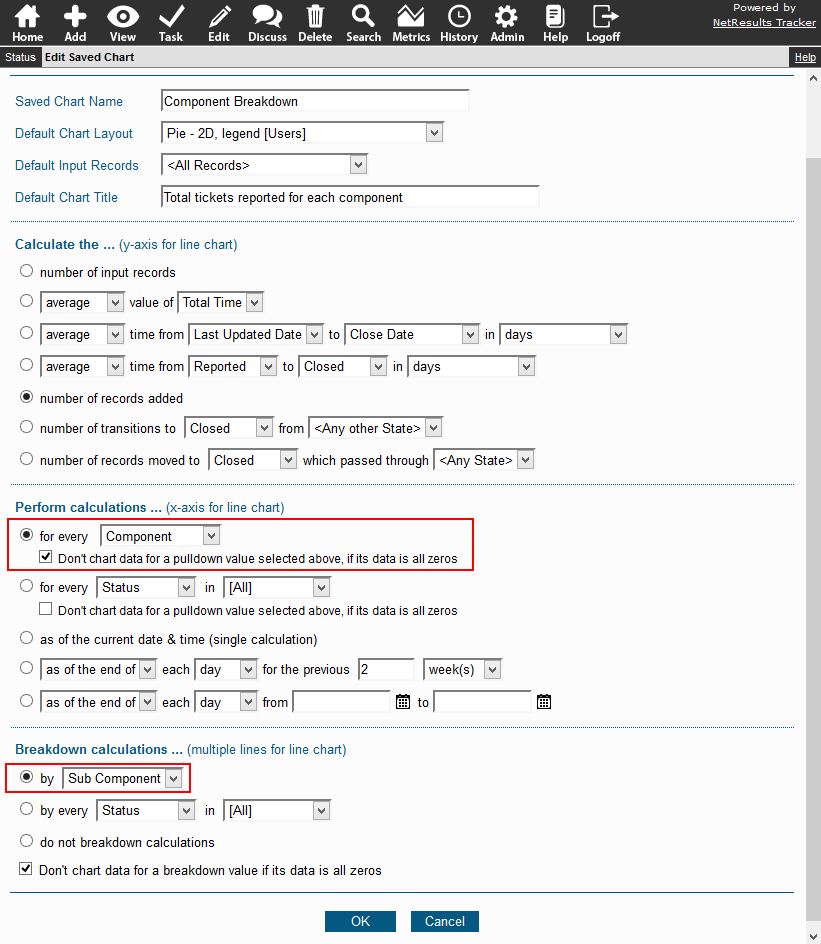
Steps for saving a chart can be found in the Metrics section of the Online Help Guide.