Is your process capturing the data you need to run the reports you want?
As business requirements change over time, management may request different metrics than were in mind when your Tracker system was configured. No need to fear. We've got tricks for adding fields to generate the reports you need.
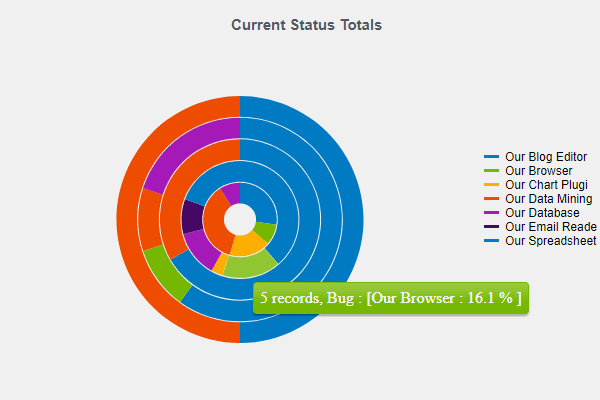
Categorize Your Data
Adding a pulldown to categorize your data is simple:
- Add a new field with Pulldown selected as the type.
- Define the option menu items.
- Include the field on the Add Page (if relevant) or add it as a task field to a transition(s) so this field can be set in new records.
Existing records will get the default value for the new field. If needed, you can use the Edit Results operation to set this field for different batches of data. Then, create charts with this field selected in the "For every..." option in the Perform calculations section or as a breakdown value.
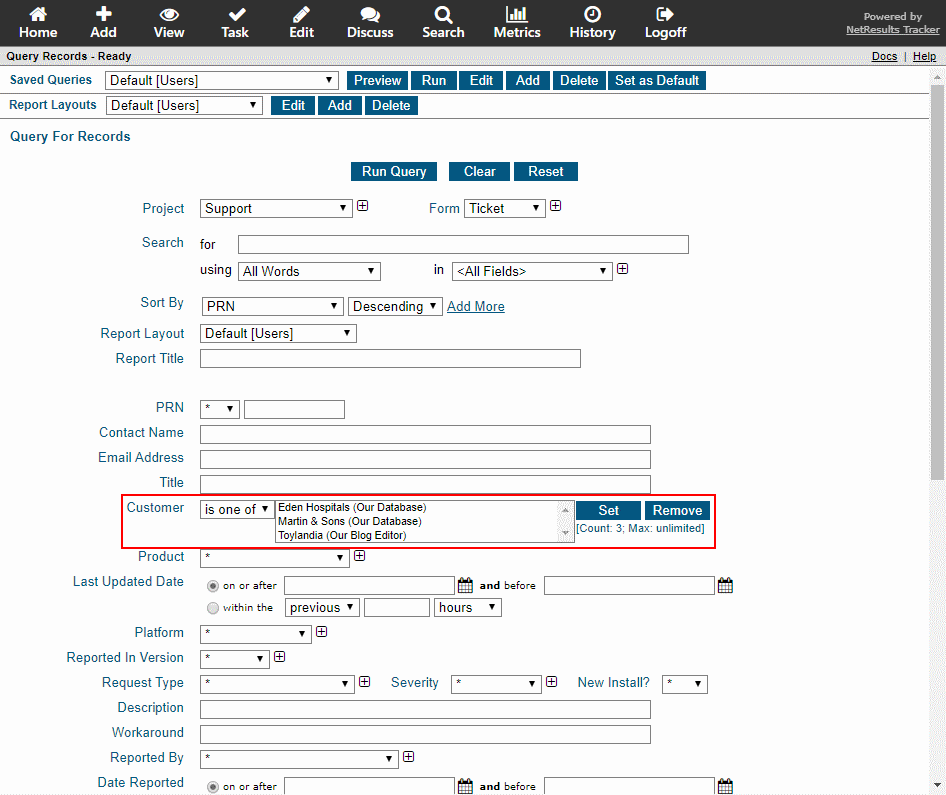
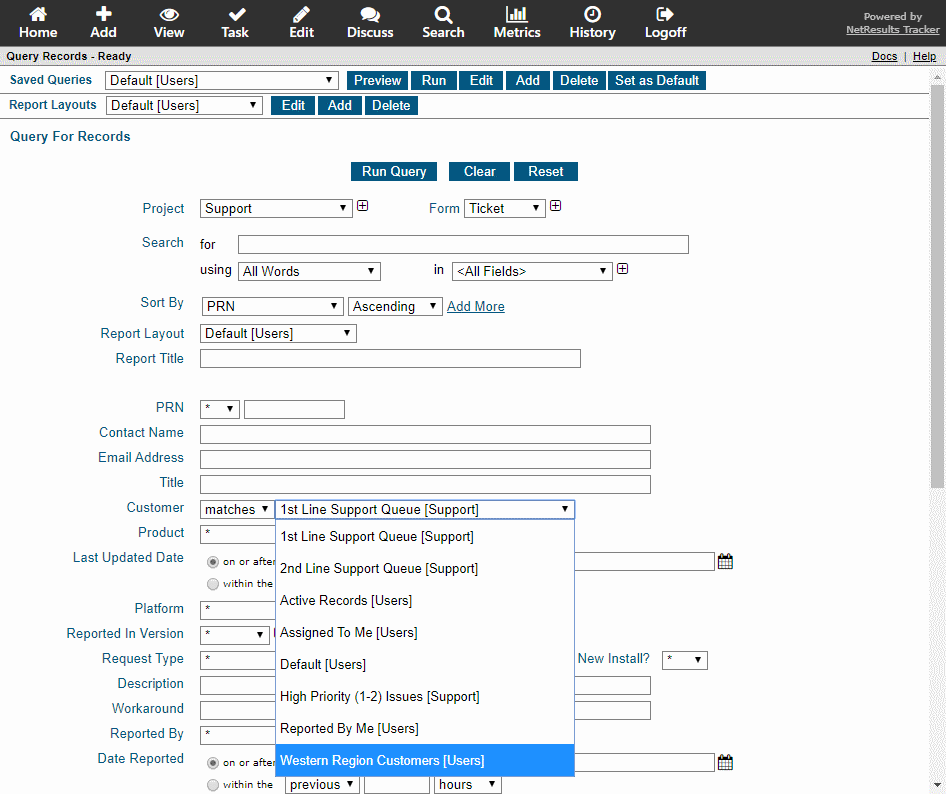
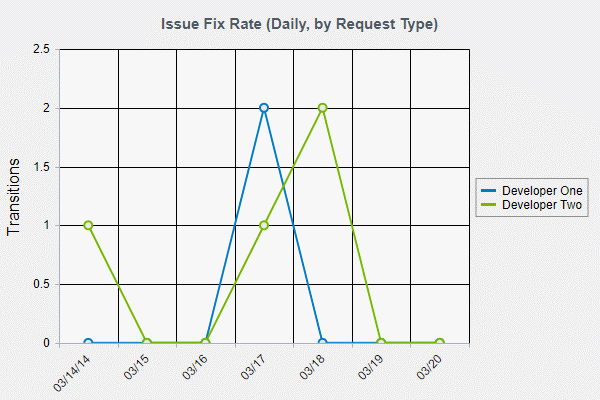
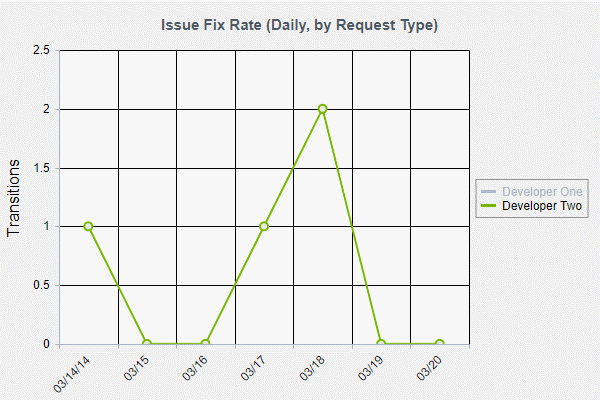
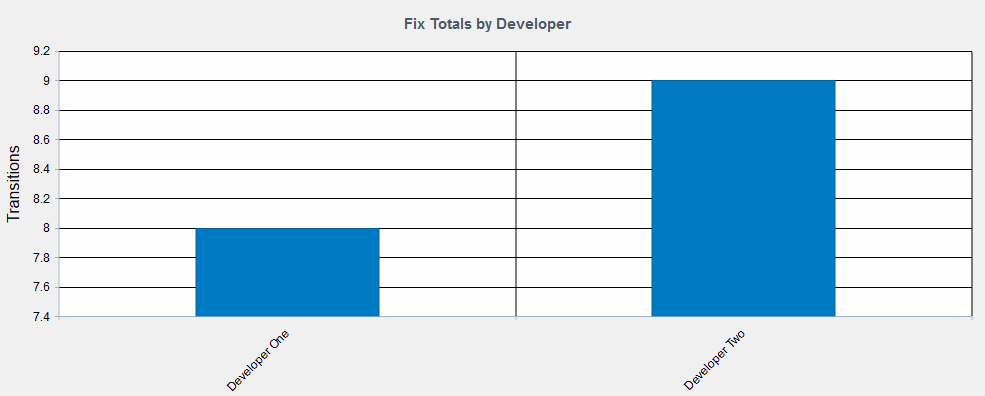
Employee Performance
A User Pulldown field can capture which user performed an action in the process (e.g. who fixed/tested/closed an issue). This Knowledge Base article has the detailed steps for setting up this type of field. It even has a wizard to help you set the value of the field for existing records. Then, create charts with this field selected in the "For every..." option in the Perform calculations section or as a breakdown value.
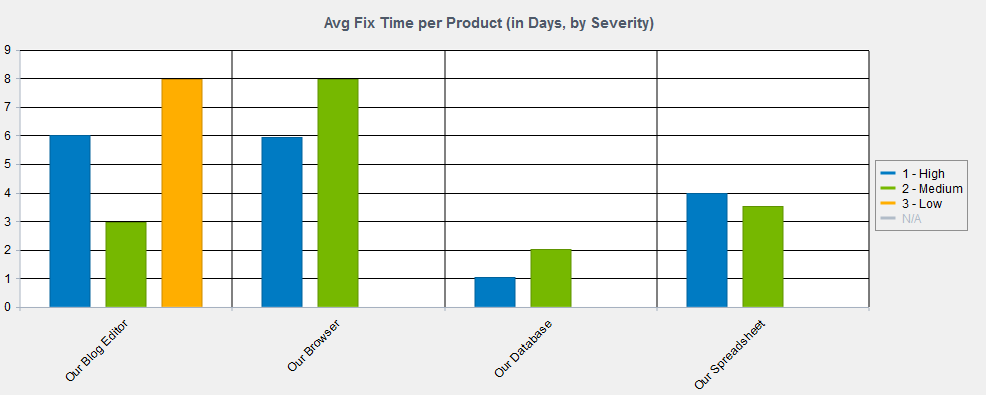
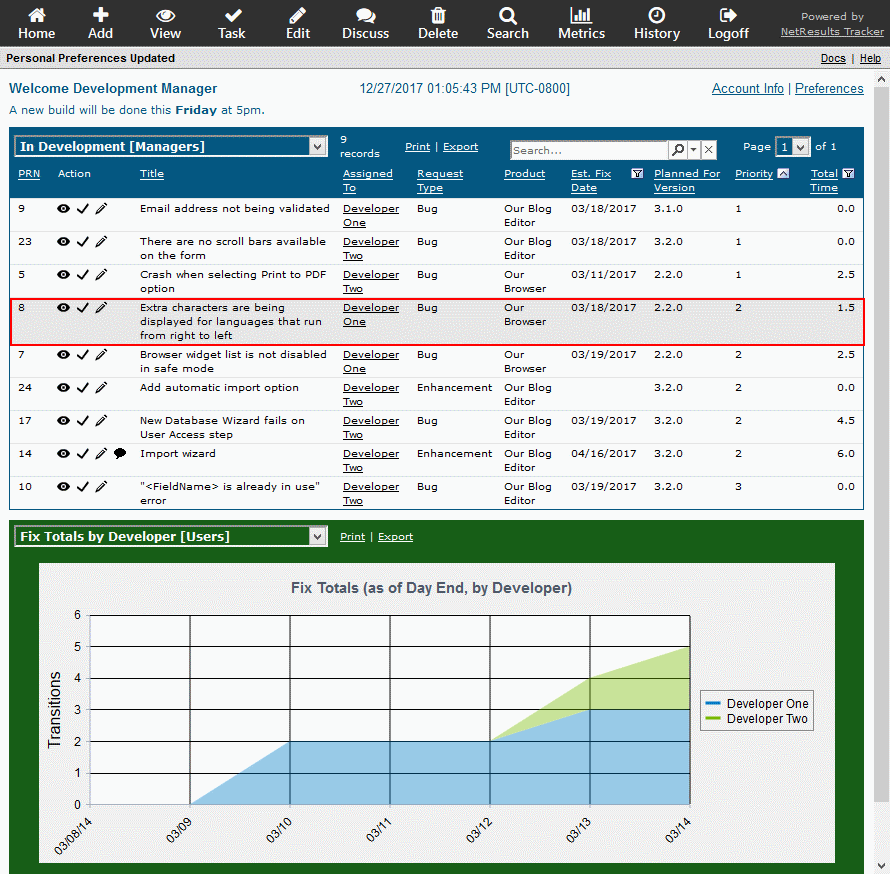
Time Calculations
Capturing important milestones in date fields will allow you to run reports that compare dates. For example, you may want to see the average time it takes to respond to a customer who contacted your Help Desk or Support team.
Add a new field with Date selected as the type. Then, add it as a task field to a transition(s) so the key date can be captured as records are processed. A date field can be set with the current date and time or can be set with a relative value. This Help section explains all of the available options.
Then, add a chart that uses the "Average time from <date 1> to <date 2>" option.