Double-click to view and other new report tricks.
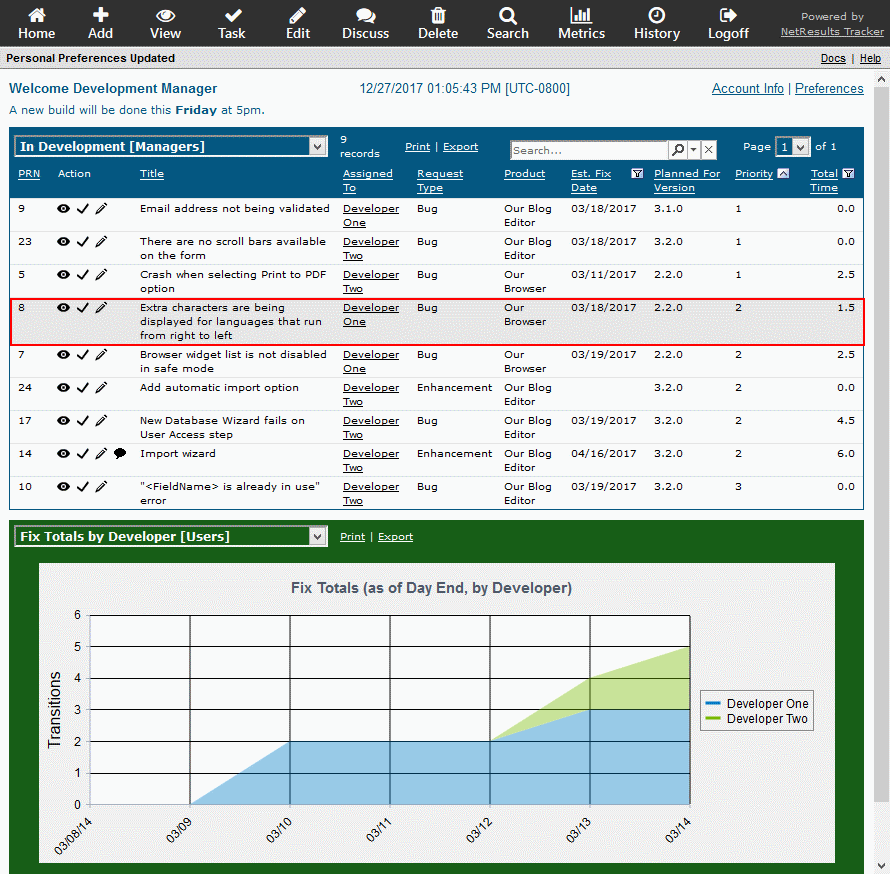
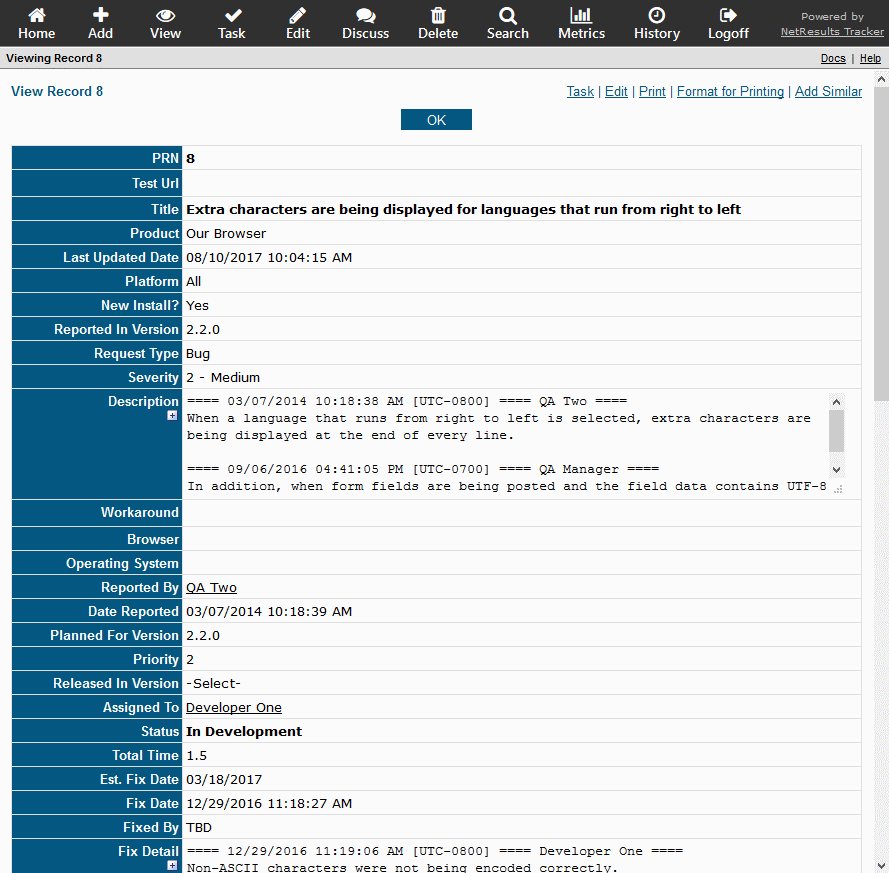
Double click on a line in a report on the Home or Query pages and you will see the View Page with full details of the record.
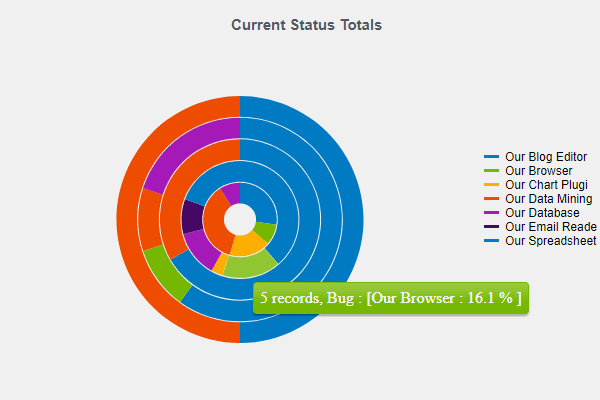
A new Metrics display engine was added to allow charts to be displayed without requiring any browser add-ons or plug-ins. It automatically adjusts the chart layout based on the data at run time. For example, it will add a legend, if needed.
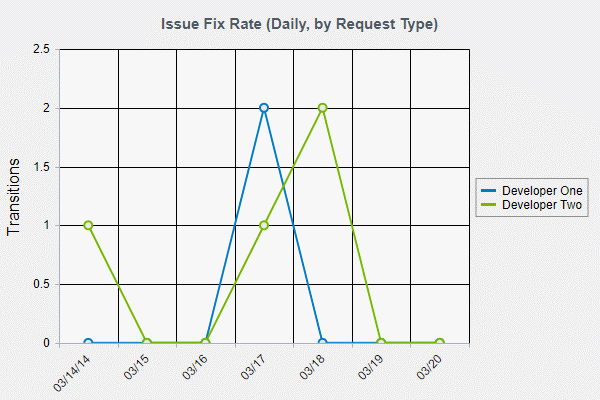
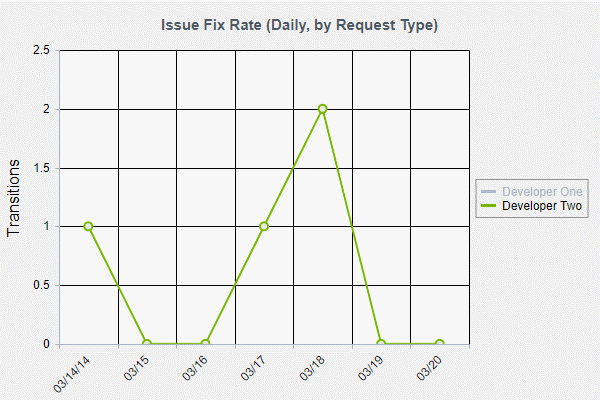
You can click on an item in the legend to hide or show it. The data for Developer One is hidden in the chart below.
Or, a donut chart will be displayed instead of a pie chart when the calculation is being broken down by an additional parameter.
These features are available in Version 7.0 or newer. Upgrade information can be found on the downloads page.