See if you have room to add new users.
Find out how to check your License Summary in the User Management System via the following video.
See if you have room to add new users.
Find out how to check your License Summary in the User Management System via the following video.
Key information for the new admin of an existing Tracker system.
Tag, you're it! Your Tracker administrator has left the company and now you need to take over. We've got you covered...check out this Knowledge Base article for details about the actions you'll most likely need to handle in this new role. Or, you can contact NetResults Technical Support to request an administrator training session and get a more comprehensive look at Tracker's Admin operations.
And, if your company's been using Tracker for a while, you might want to take advantage of our tune-up service to help you make the most of your system. We can help you streamline your process and enable new features that can help make things easier.
Version 7.1.0 of NetResults Tracker has been released.
It adds support for SQL Server 2017 on Linux.
Home and Query page reports include an option to search all fields (not just those in the report).
The new (for 7.0) metrics display engine has been further enhanced with easier to read display of trend metrics and an option to specify precision in floating point display.
Small icons have been replaced with font icons for faster page loading and improved clarity.
It includes version 2 of the webhooks preview. Integrate Tracker with your own or third-party software. Use Notification Rules to custom configure calls from Tracker to other applications at key points in your workflow.
Please review the 7.1.0 feature list for details.
Upgrade instructions and download information are available on the downloads page.
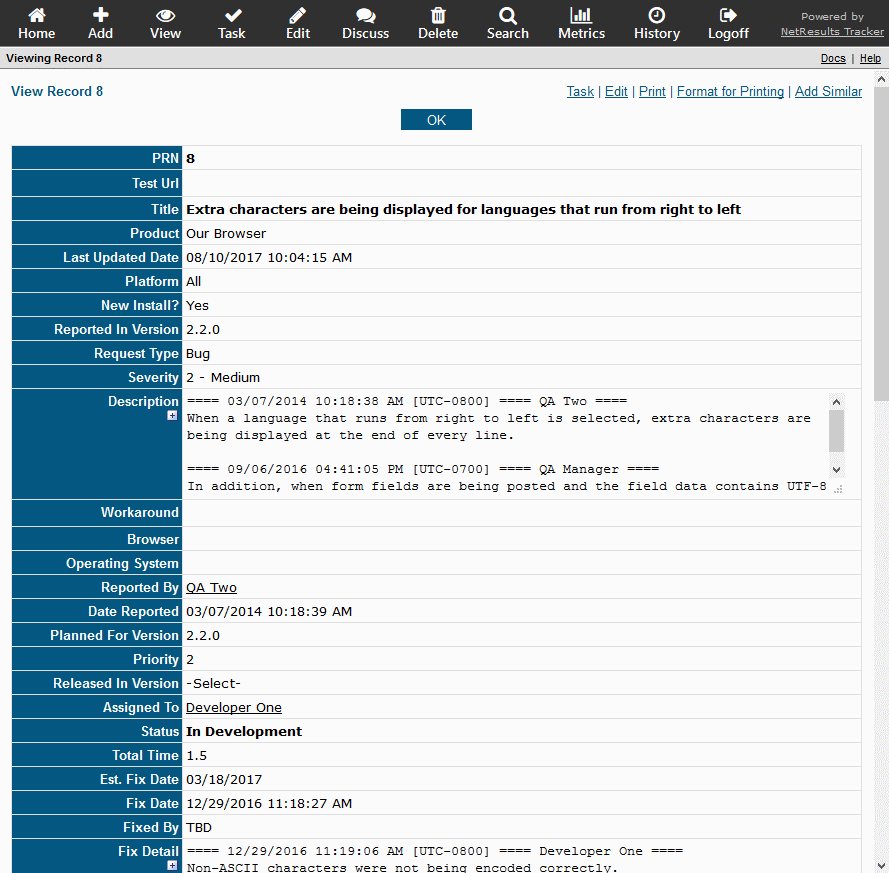
Double-click to view and other new report tricks.
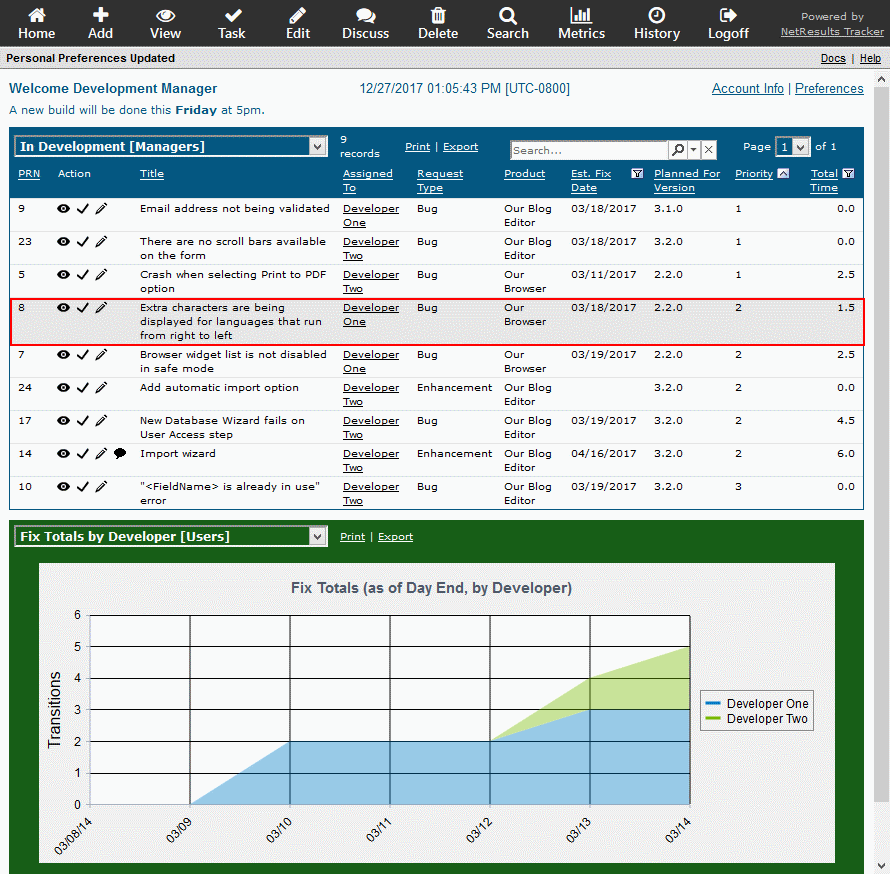
Double click on a line in a report on the Home or Query pages and you will see the View Page with full details of the record.
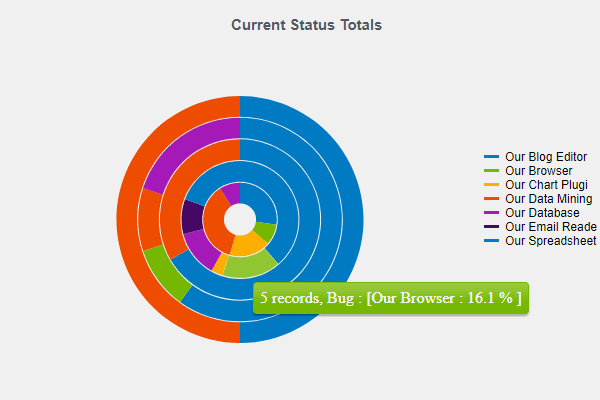
A new Metrics display engine was added to allow charts to be displayed without requiring any browser add-ons or plug-ins. It automatically adjusts the chart layout based on the data at run time. For example, it will add a legend, if needed.
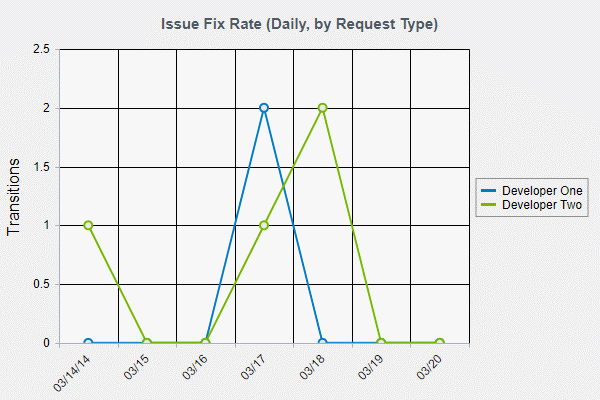
You can click on an item in the legend to hide or show it. The data for Developer One is hidden in the chart below.
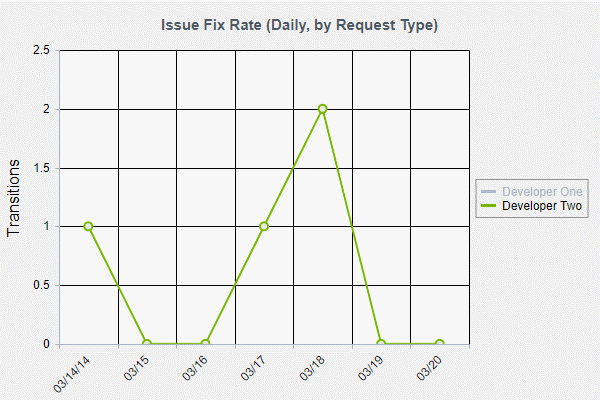
Or, a donut chart will be displayed instead of a pie chart when the calculation is being broken down by an additional parameter.
These features are available in Version 7.0 or newer. Upgrade information can be found on the downloads page.
Alerts can be sent and repeated in 15 minute increments.
If you're using Alerts to regulate response times, you can trigger notifications in 15, 30 or 45 minute increments in Version 7.0 or newer.
You can set Alerts such that when a severity 1 issue is reported, it can trigger an alert every 15 minutes until someone takes action on the issue.
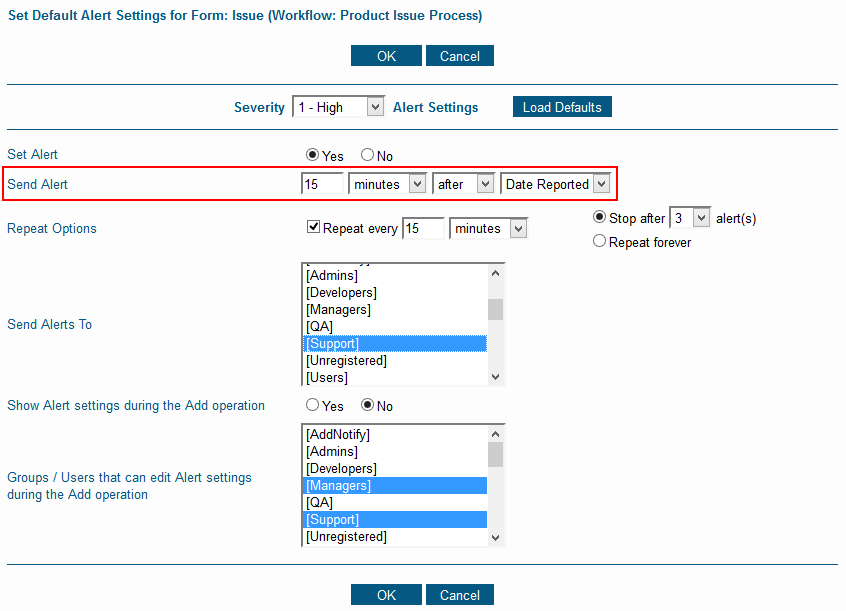
To configure alerts this way, check out the based-on alerts blog post for details.
Information about upgrading to Version 7.0 or newer can be found on the downloads page.