You can limit the data in a chart to include only items that match a saved query. This can be saved in the chart options or can be changed on the fly to be run one time.
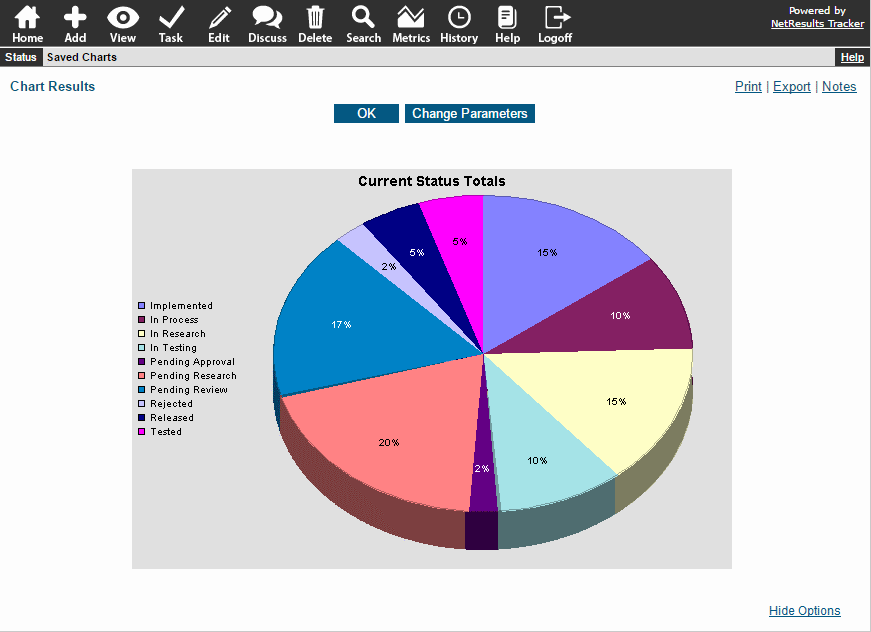
Let's run the Project Status chart that comes out of the box. It shows a pie chart with all records in the system broken down by status.

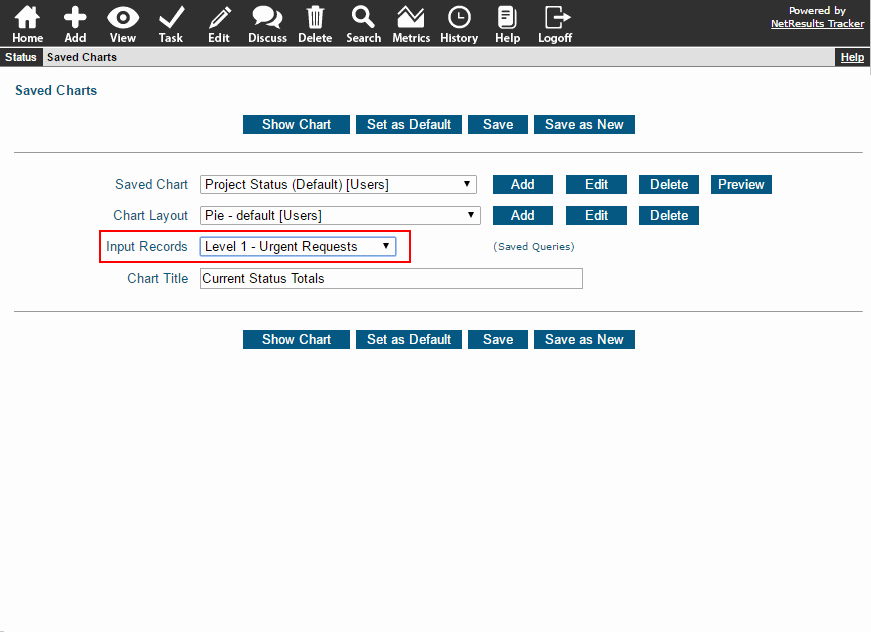
Now let's run the chart to show only urgent requests. To do this, select a saved query that returns those records in the Input Records option.

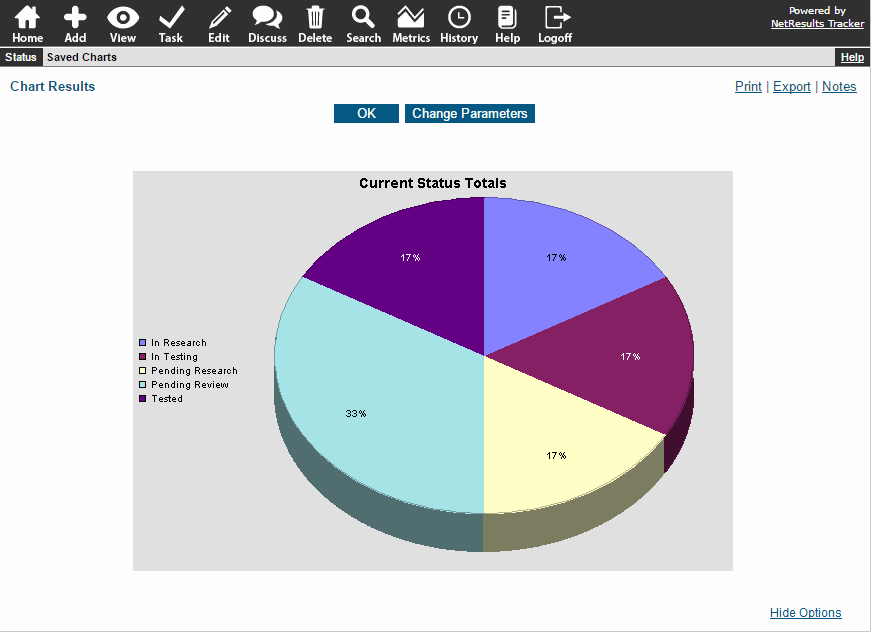
Here's the filtered chart:

The example above will only run the chart that way once. To save this in the chart, use the Edit option to change the Default Input Records property.
