Configure fields in your QA process to help measure and analyze performance.
Track Time Spent
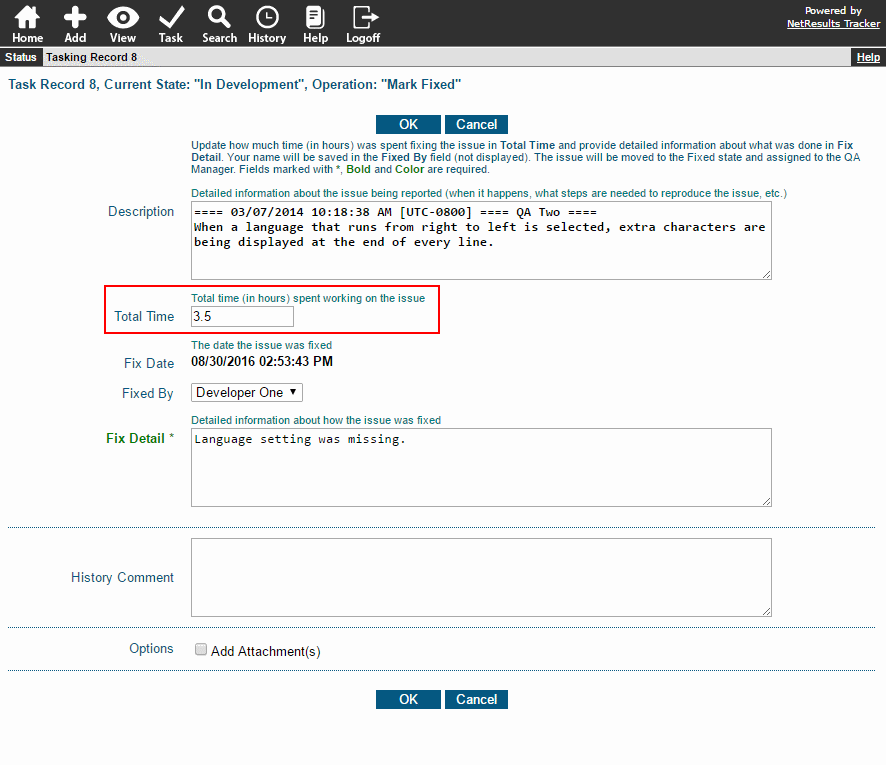
There are different ways to track how much time was spent on testing. You can set up a Floating Point or Integer field as described in this Knowledge Base article so QA Engineers can enter how much time was spent testing a fix.
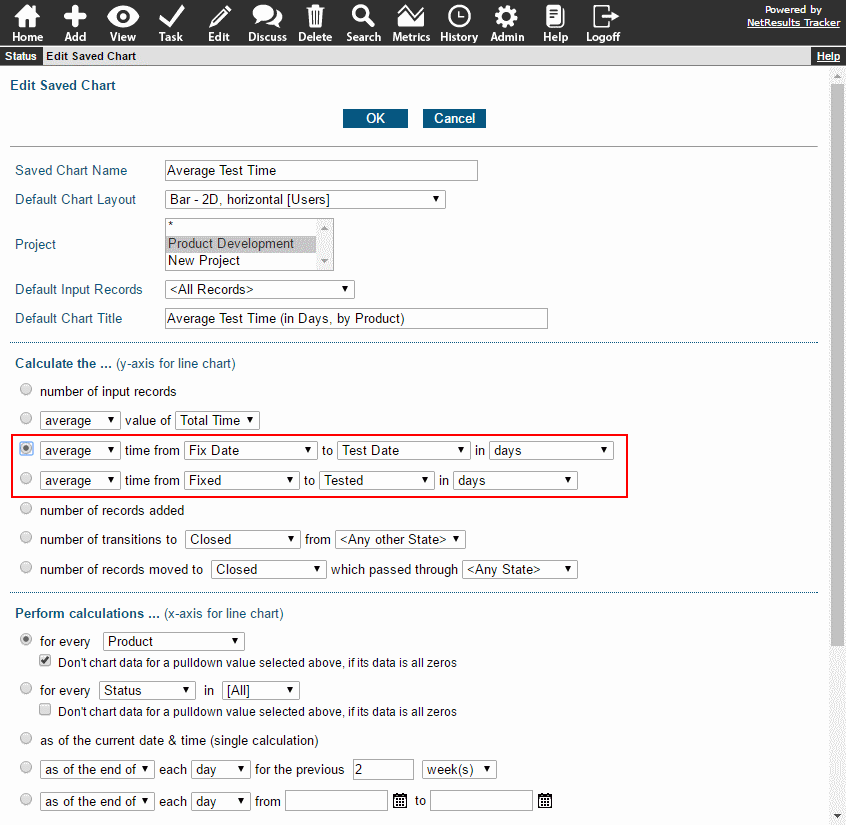
Or, you can run a chart that compares the date an issue was fixed with the date it was tested. The chart can calculate this by comparing date fields or when the issue was in particular workflow states. Create a chart using the Metrics section of the Online Help Guide.
Note Who Tested Each Issue
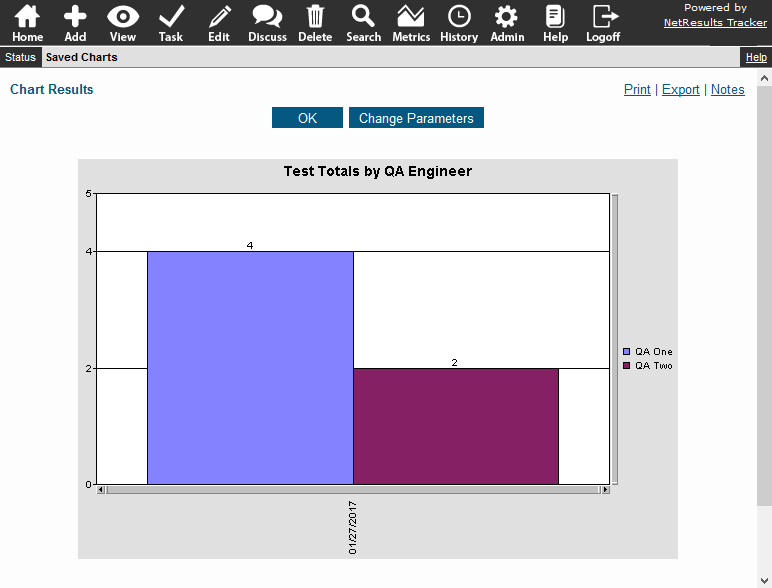
Setting up a field to save which QA Engineer tested each issue allows you to report on how many issues were tested by each QA Engineer. The User Pulldown Knowledge Base article provides steps for setting this up.
Categorize Items That Fail Testing
Classifying the items that fail testing can help you identify trends and address them.
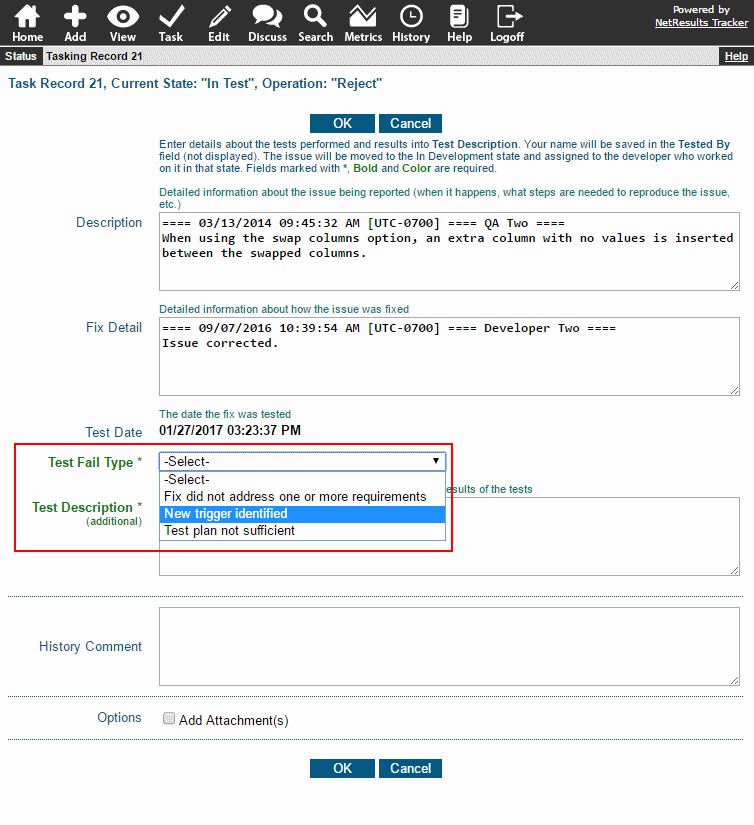
To add a Pulldown field:
- Login as Admin and click on the Admin icon.
- Click on the Fields link.
- Click on the Add Field button.
- Select Pulldown as the type and click Continue.
- Make selections for the options available for Pulldowns
- Click OK to save the new field.
- Click on the Manage Forms for This Field button.
- Click on the desired form and click Add.
- Add option menu items to the field.