Build a chart to help you identify trends in your data.
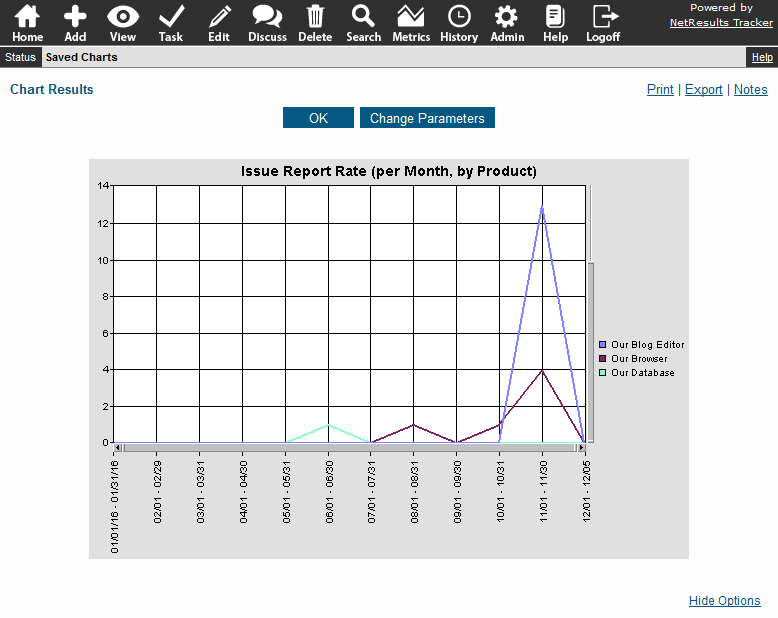
Create a line chart, select the date range and break down the data by a pulldown, if desired.
The sample above shows the monthly rate of issues reported against various products.
Use a Saved Query as a Filter
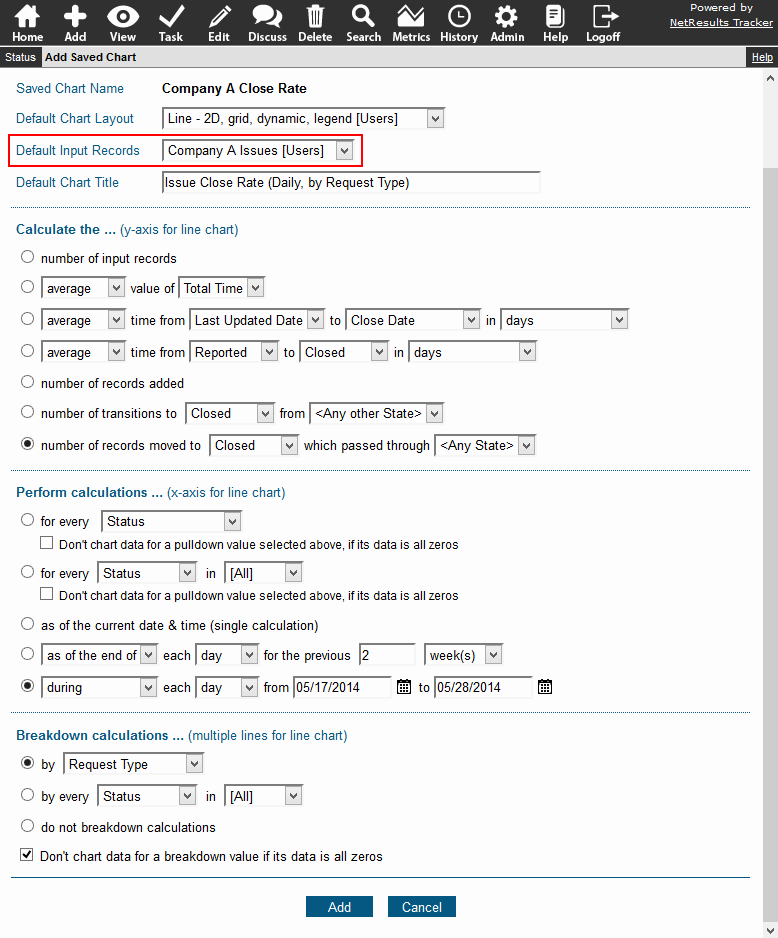
You can select a saved query that will limit the data included in the chart. The Default Input Records option in the sample below shows we've selected a saved query that will only show tickets reported by Company A in the chart.
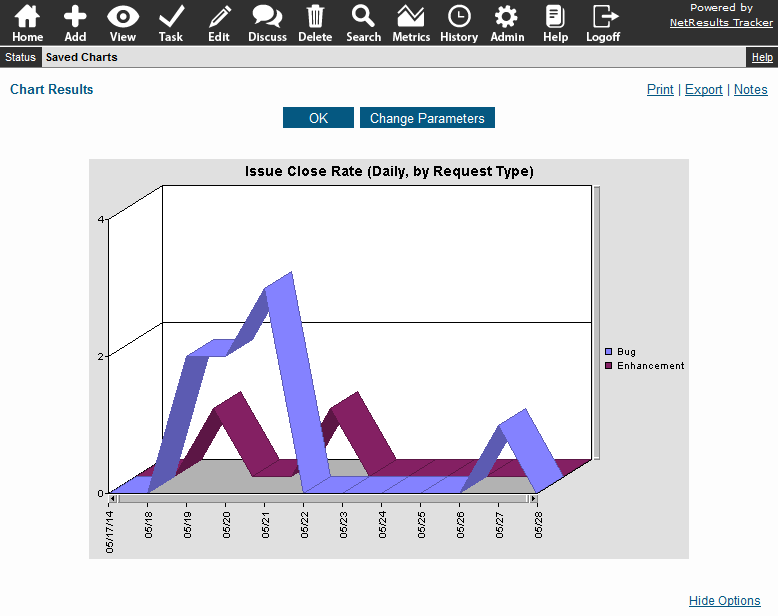
Here's the resulting chart.
Steps for creating a chart can be found in the Metrics section of the Online Help Guide.