Use Metrics to review your process and find steps that can be improved.
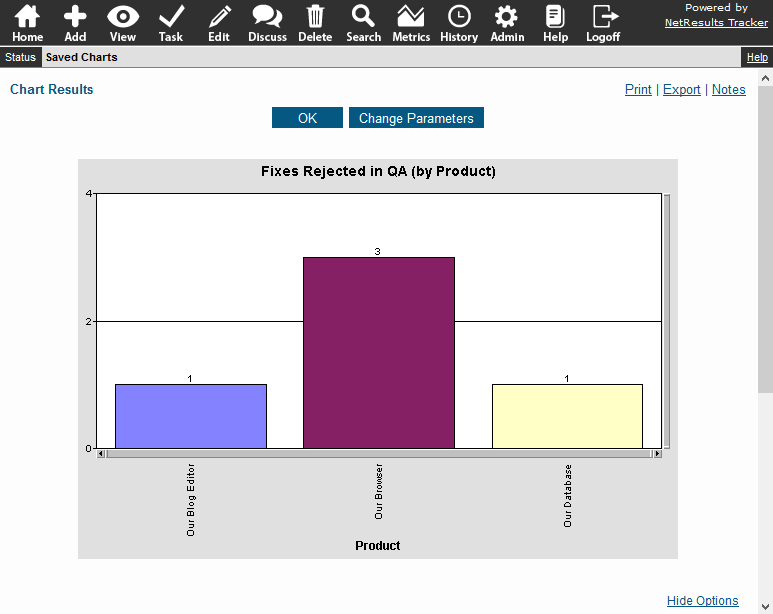
A workflow step that involves testing or approval is an easy place to start. For example, you can run a chart that shows how many fixes have been rejected by QA.

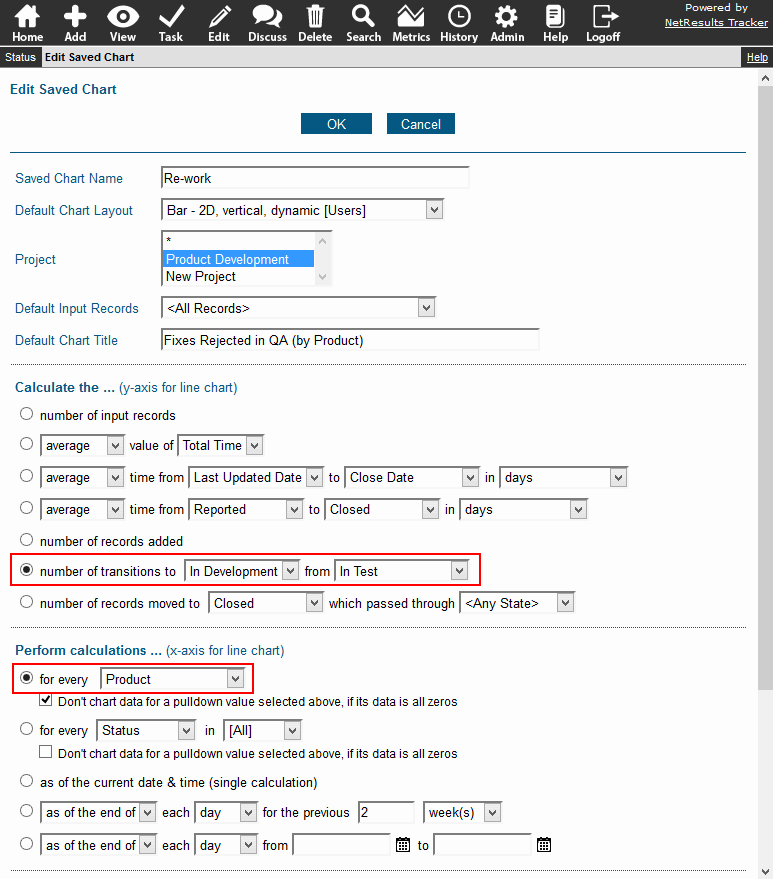
This is done using the chart option that calculates how many records moved from one state to another. You can break the data down by a pulldown as we've done with Product.

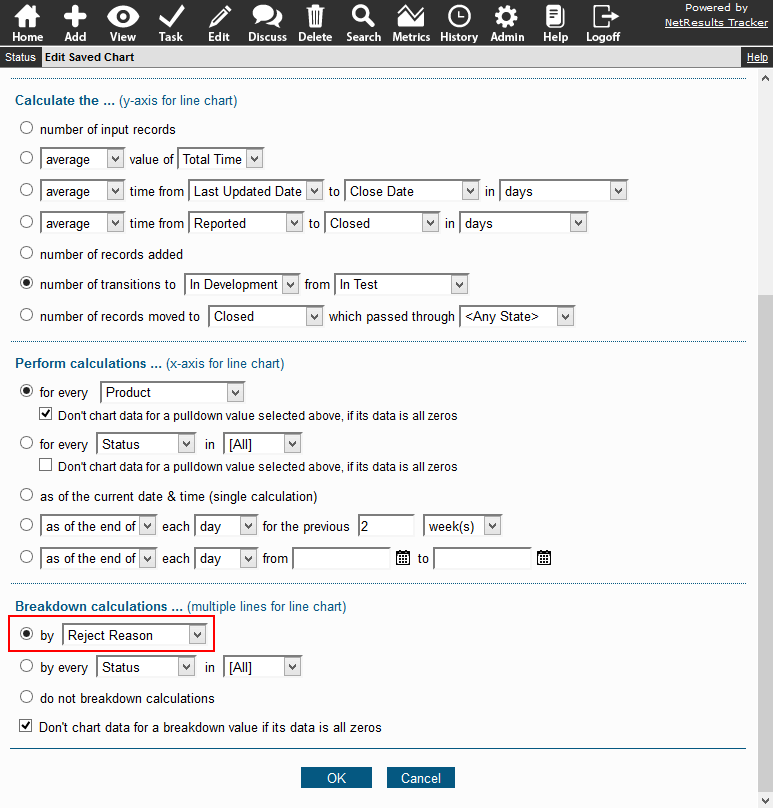
Reviewing the data can help you identify categories or trends. You may find it helpful to create a pulldown field that categorizes the reasons for rejecting a fix so that reports can be run against that criteria. You can use this field to break down the chart data even further.

Detailed steps for creating a chart can be found in the Online Help Guide.
