See a breakdown of items assigned to each team member with a workload chart.
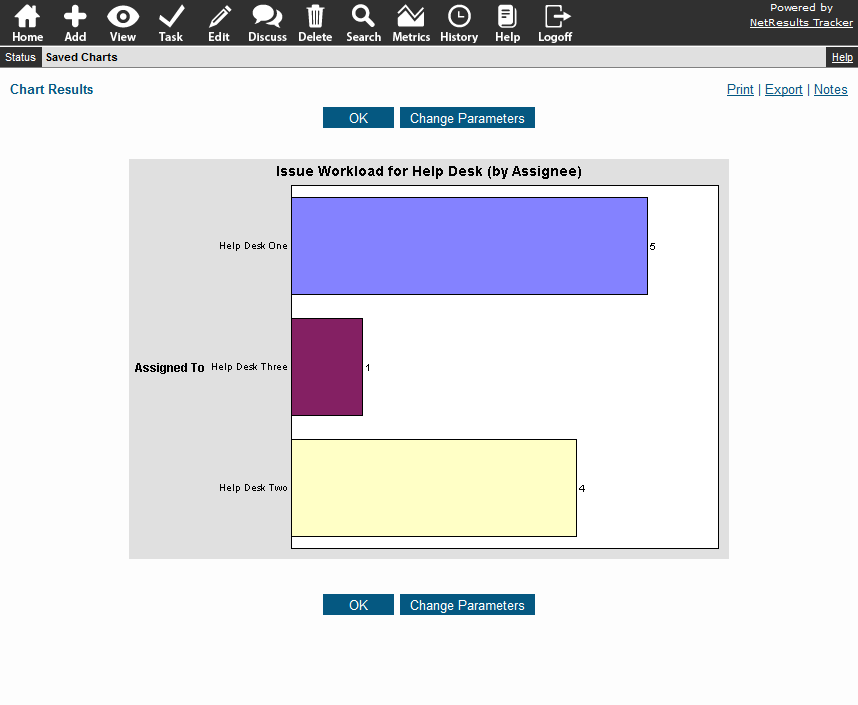
Add this report to your Home Page to easily access this information at any time.
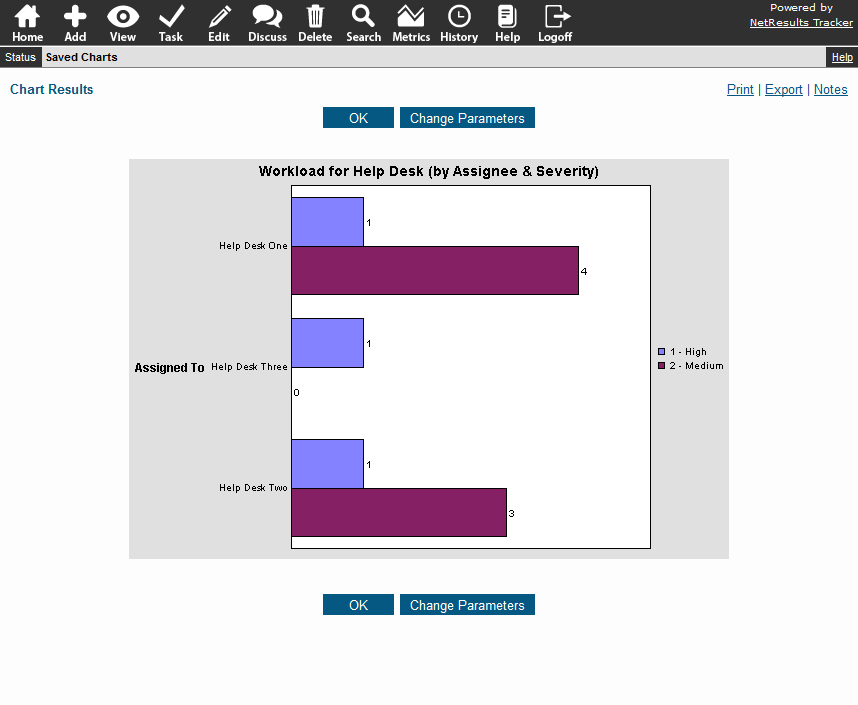
You can also breakdown the data down further as we did to show Severity in this chart.
Take a peek at the settings we used to make this chart.
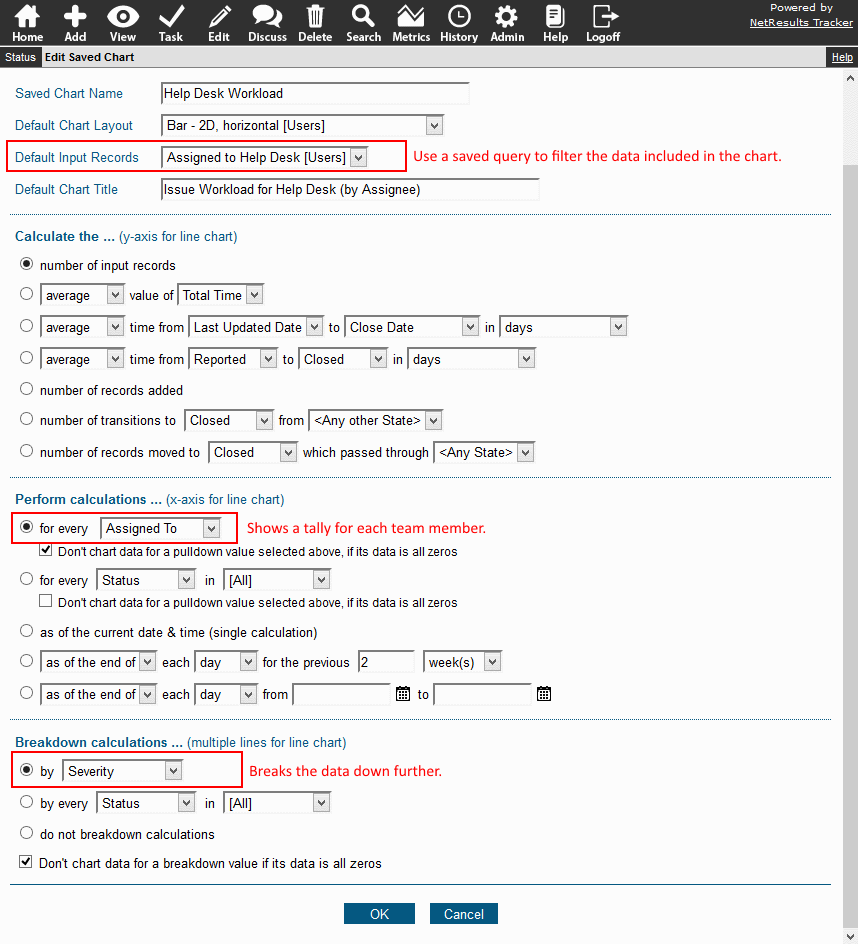
Steps for adding a chart can be found in the Metrics section of the Online Help Guide.
To add the report to the Home Page:
- Login to Tracker.
- Click on the Preferences link in the upper right corner.
- Select the chart for one of the Home Page Report options.
- Click OK to save the change.