Want to choose which fields are displayed in the report results?

Report Example

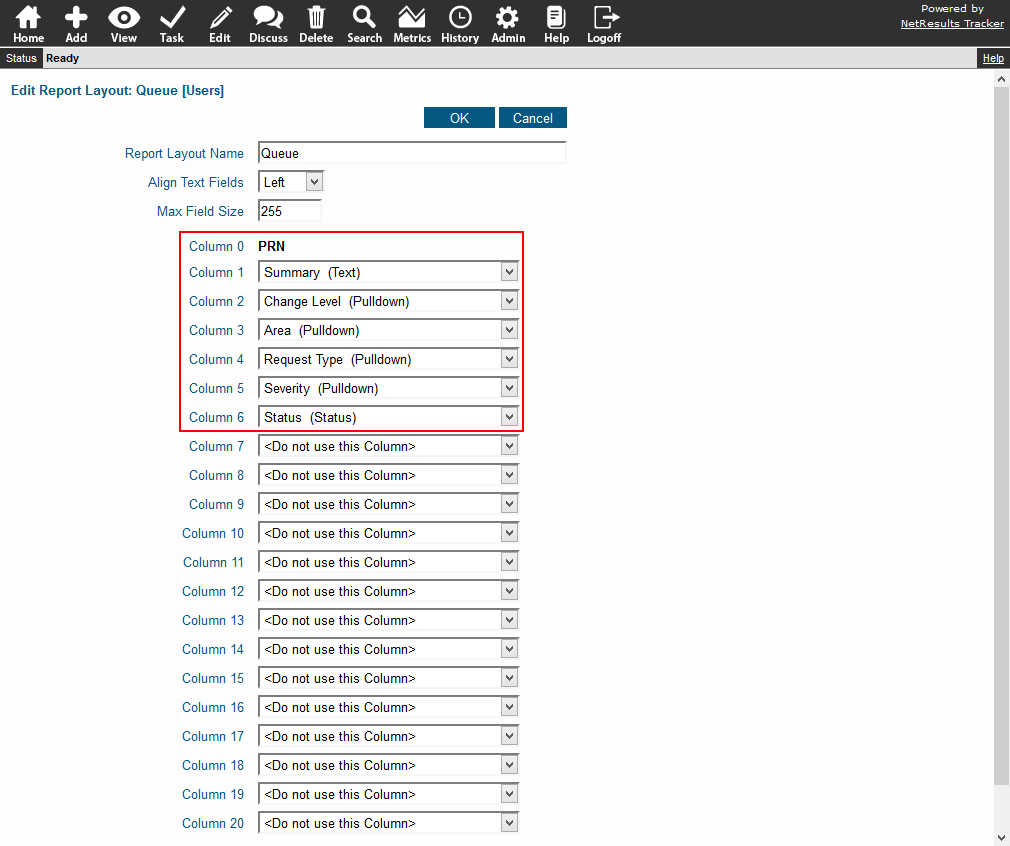
A report layout determines which fields are used as the columns in the report results. Here's an example of a layout. Pick a field or other options like attachments for each column:
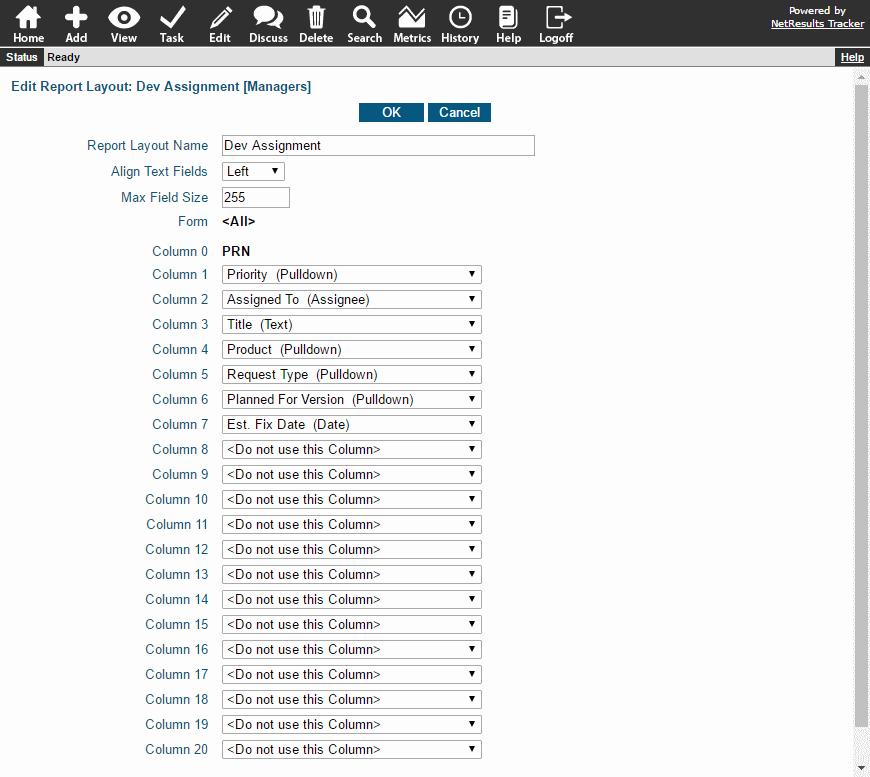
Report Layout

If you're working with a report saved for a group (the report has [User Group Name] listed at the end of the name), you'll need to have the appropriate privileges to edit the layout being used. Or, you can copy the report and create your own layout.

Edit a Report Layout

  1. Click on the Search icon.
  2. In the Saved Queries pulldown at the top, select the report that you want to modify.
  3. Check the Report Layouts pulldown right under the Saved Queries pulldown. The report layout associated with the saved query will be selected.
  4. Click on the Edit button to the right of the Report Layouts pulldown.
  5. Make any desired changes to the fields selected in the columns. Details about the options available can be found in the Using Saved Queries & Reports section in the Online Help Guide.
  6. Click OK to save the changes.

Copy an Existing Report and Create Your Own Layout

  1. Click on the Search icon.
  2. Click on the Add button to the right of the Report Layouts pulldown.
  3. Enter a name for your layout, then select whether it will be a "Personal" (only you can see and use it) or "Group" (anyone in the user group you select can use it) layout. If you selected "Group", select a user group.
  4. Click Next.
  5. Select the desired fields for the report columns. Details about the options available can be found in the Using Saved Queries & Reports section in the Online Help Guide.
  6. Click OK to save the layout, then click OK again after it is has been saved.
  7. Now copy the report: In the Saved Queries pulldown at the top, select the report that you want to copy, then click on the Add button to the right of the Saved Queries pulldown.
  8. Enter a name for your report, then select whether it will be a "Personal" or "Group" report. If you selected "Group", select a user group.
  9. Click Next.
  10. You will see that the criteria from the original report will be displayed. In the Report Layout pulldown, select the layout you created, then click Add. Click OK after it has been saved.
  11. If you would like to see this report on your Home Page when you login, click on the Home icon, then click on the Preferences link in the upper right. Select the new report for one of the Home Page Report options and click OK.

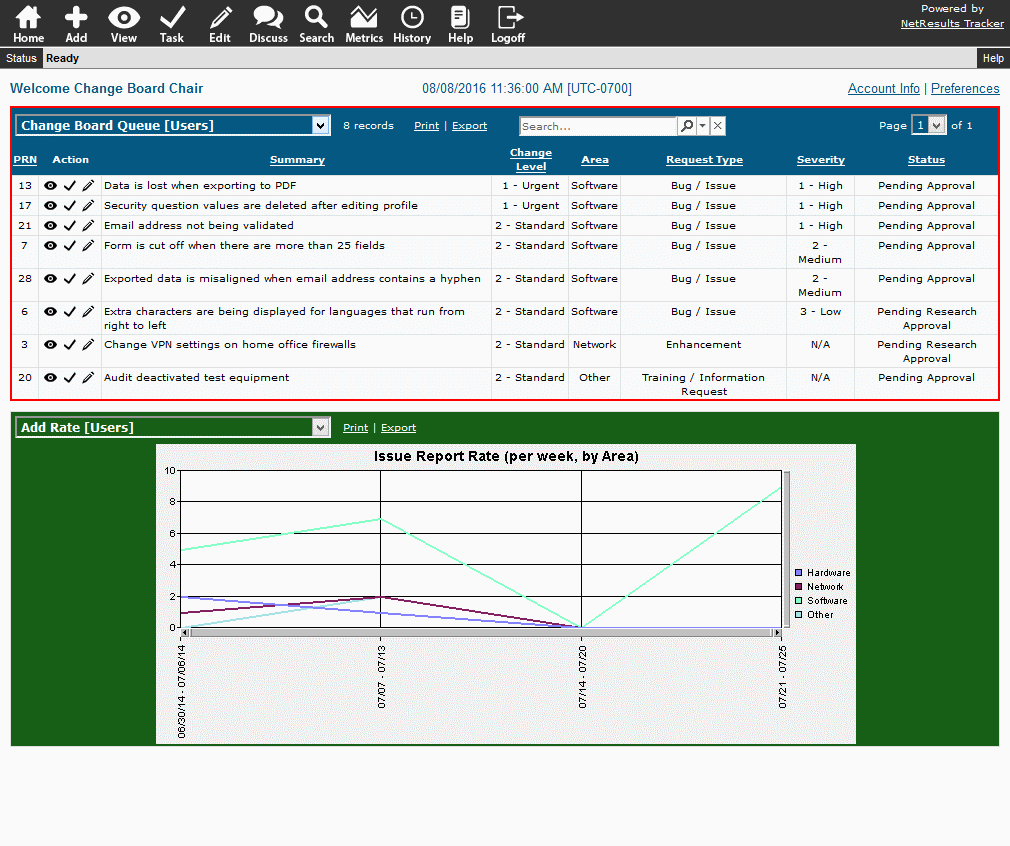
A Tracker report can organize the content for a variety of meetings: Change Board Review, Product Enhancement Review, Help Desk / Customer Support Triage, Task Force, Daily Scrum.

Meeting Agenda

Create a Report Layout

Save a report layout that shows the fields you want to see in the report. For example, the Title/Summary, Priority and any other key information that should be available for quick reference. Select "Group" as the Type and select the group of users participating in the meeting so everyone participating in the meeting can access the information. Details for saving a report layout can be found in the Using Saved Queries and Reports Help section.

Report Layout

Create a Saved Query

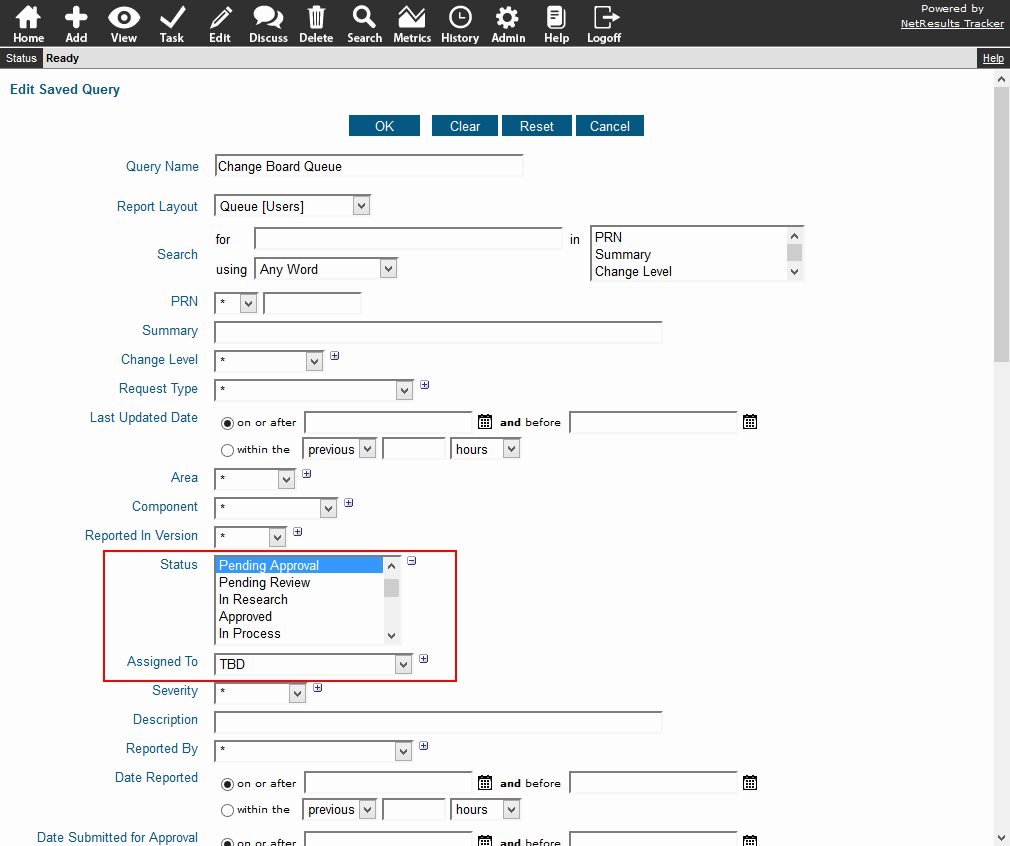
You might already have a report (e.g. Change Board Queue, Help Desk / Support Queue, Product Enhancement List). If not, set up a saved query that will return the records to be discussed in the meeting. Steps for saving a report are in the Using Saved Queries and Reports section. You'll want to make this a "Group" report, too.

Query Criteria

Perform a search on the system's audit trail.

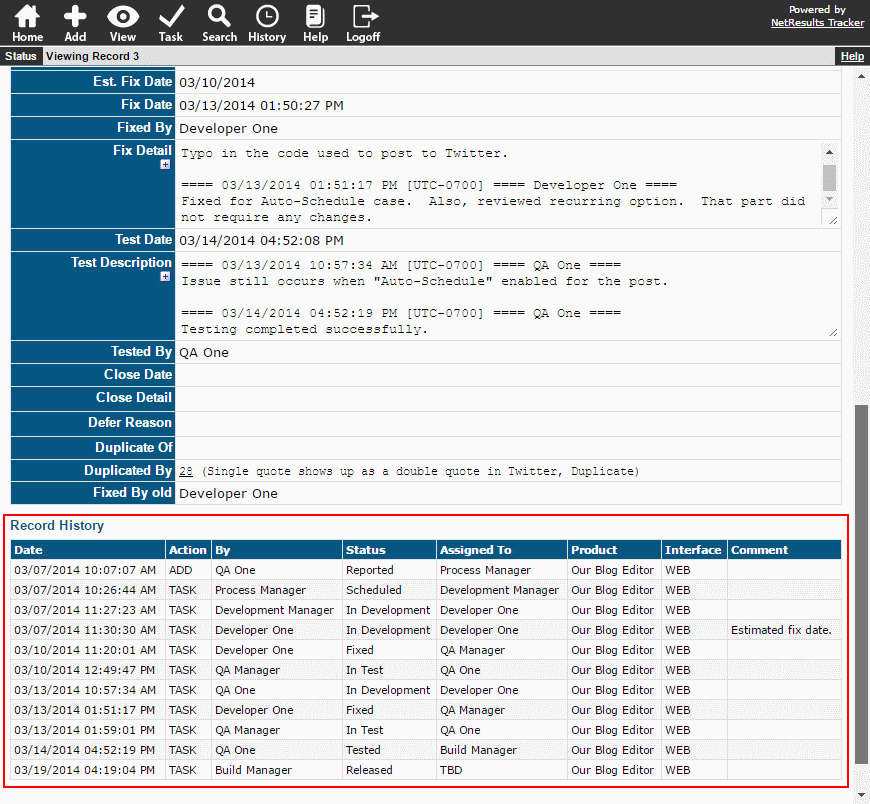
Record History

Information about every action performed on a record is saved in Tracker's record history. The History Page allows you to perform searches against this wealth of data. Perhaps you want to see what changes were made last week or locate records that moved from one workflow step to another. For example, find issues where the fix failed testing.

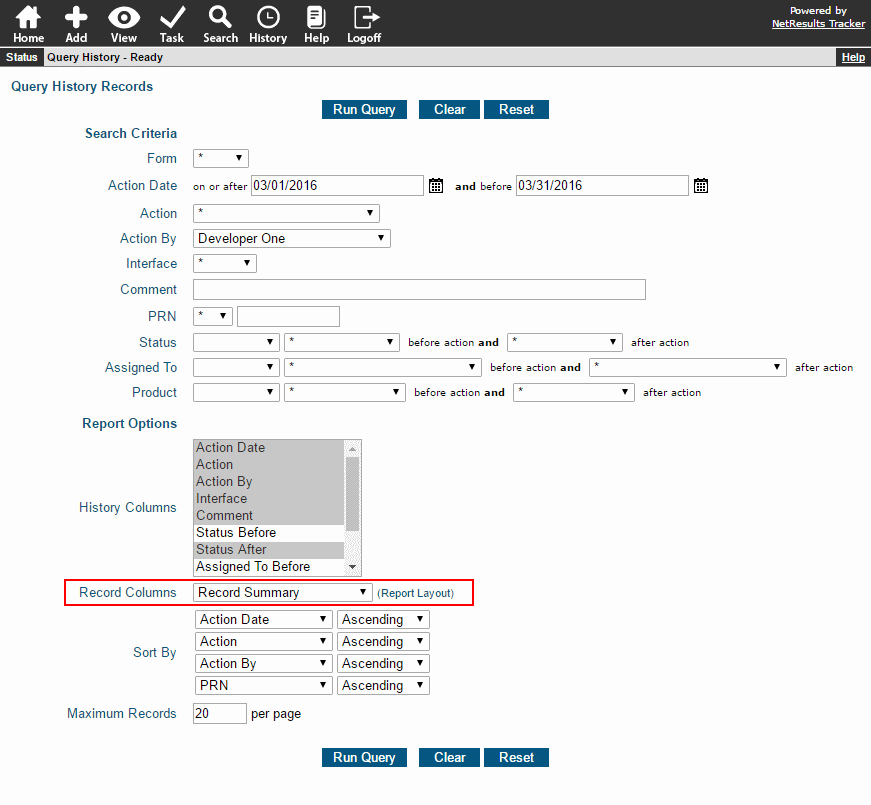
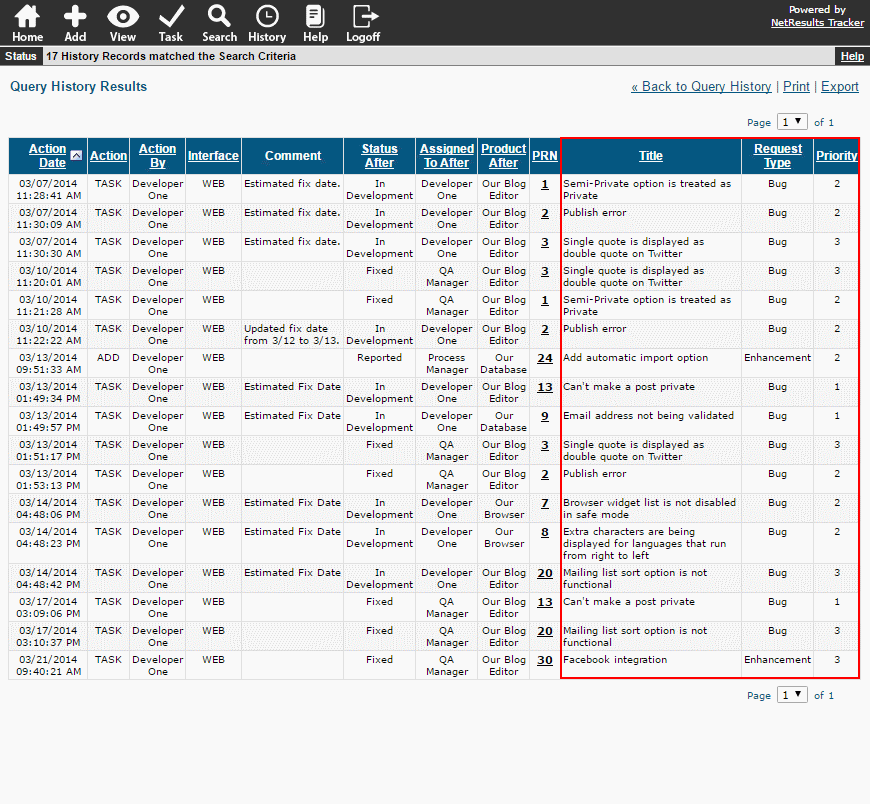
To run a History search, click on the History icon in the button bar. Make selections for the criteria. The Comment field accepts key word(s) to search the History Comment field available during the Edit and Task operations. If you would like to see the record data as part of the results, you can select a report layout for Record Columns. The criteria selected here will show us all actions performed by Developer One for the specified date range.

Search Criteria

The columns to the right of PRN are the columns in the report layout selected on the Search Page.

Search Results

For more details about the available search options, please review the Record History Help section.

You can limit the data in a chart to include only items that match a saved query. This can be saved in the chart options or can be changed on the fly to be run one time.

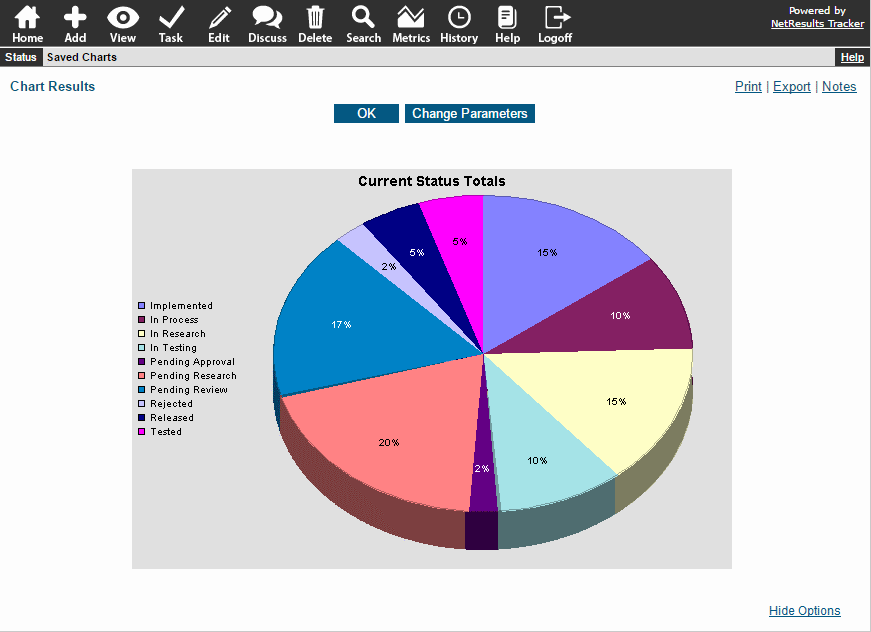
Let's run the Project Status chart that comes out of the box. It shows a pie chart with all records in the system broken down by status.

Project Status

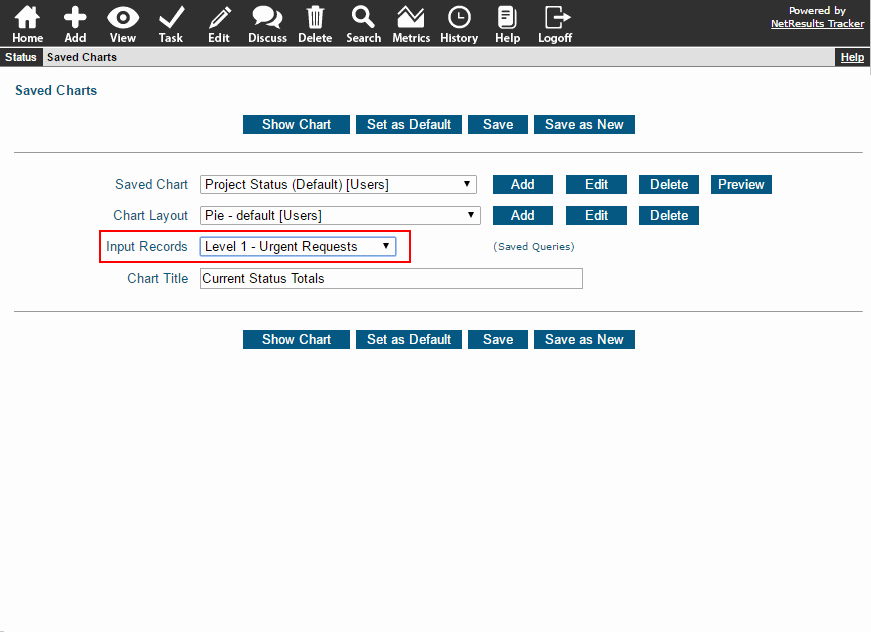
Now let's run the chart to show only urgent requests. To do this, select a saved query that returns those records in the Input Records option.

Input Records Option

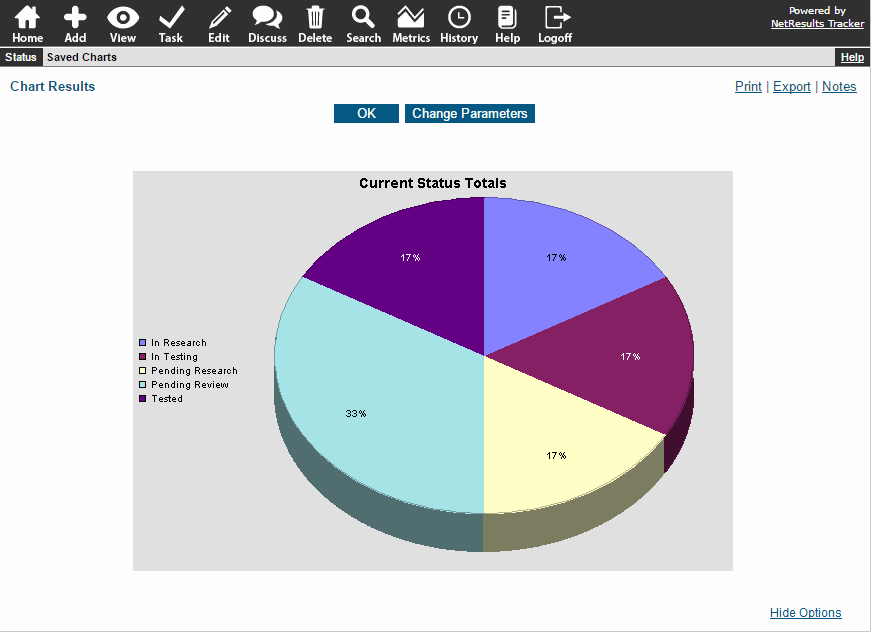
Here's the filtered chart:

Project Status - Urgent Requests

The example above will only run the chart that way once. To save this in the chart, use the Edit option to change the Default Input Records property.

Do you have a field that is a list of users' names in it?

Did you know that you can configure a pulldown field to be a "User Pulldown" that can be associated with a Tracker user group? The list of names is automatically maintained by Tracker as users are added or removed from the user group. You can send email notifications to this user and you can use this field in report criteria.

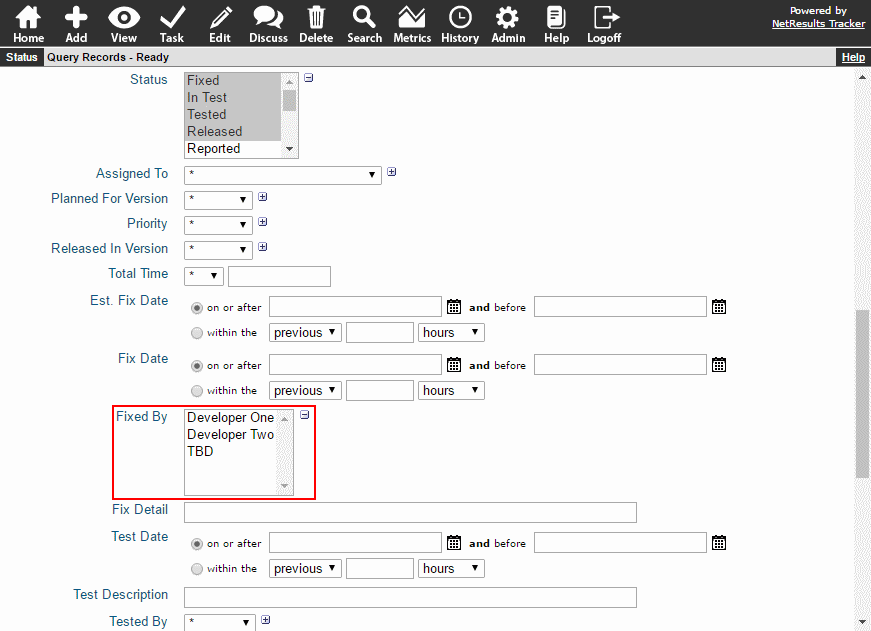
User Pulldown as Query Criteria

Run Reports Based on Who Fixed/Tested/Closed an Issue

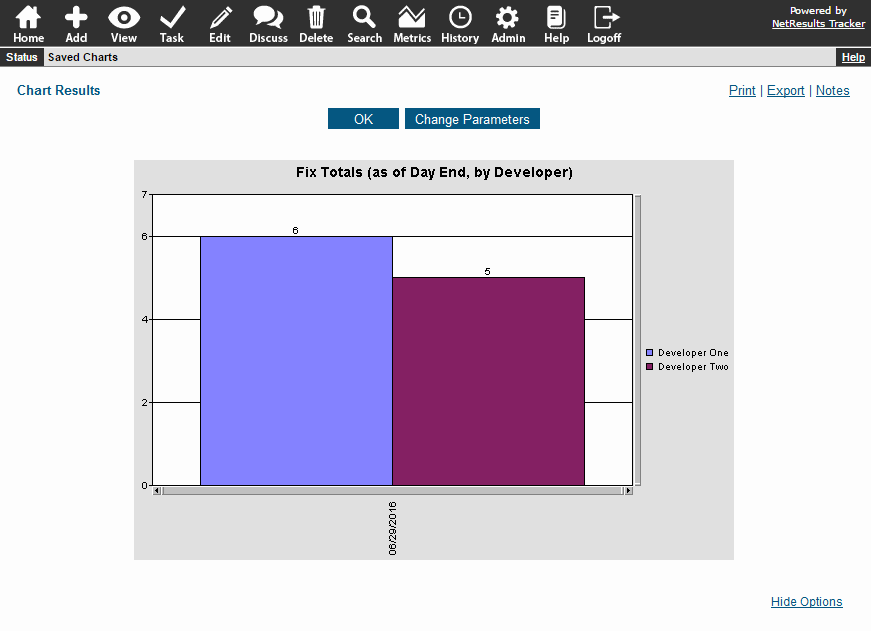
Want a report that shows how many tickets were fixed by each developer? Add a user pulldown field called "Fixed By". At the point in the workflow where an issue is fixed, you can set the transition so it will save the user's name in the "Fixed By" field. Then, run a chart using the "for every Fixed By" option in the "Perform Calculations..." section. Check out the User Pulldown Knowledge Base article for details on how to create this type of field.

Chart Showing Total Issues Fixed By Developer