See a breakdown of items assigned to each team member with a workload chart.

Workload Chart

Add this report to your Home Page to easily access this information at any time.

You can also breakdown the data down further as we did to show Severity in this chart.

Workload Chart with Severity Breakdown

Take a peek at the settings we used to make this chart.

Workload Chart Settings

Steps for adding a chart can be found in the Metrics section of the Online Help Guide.

To add the report to the Home Page:

  1. Login to Tracker.
  2. Click on the Preferences link in the upper right corner.
  3. Select the chart for one of the Home Page Report options.
  4. Click OK to save the change.

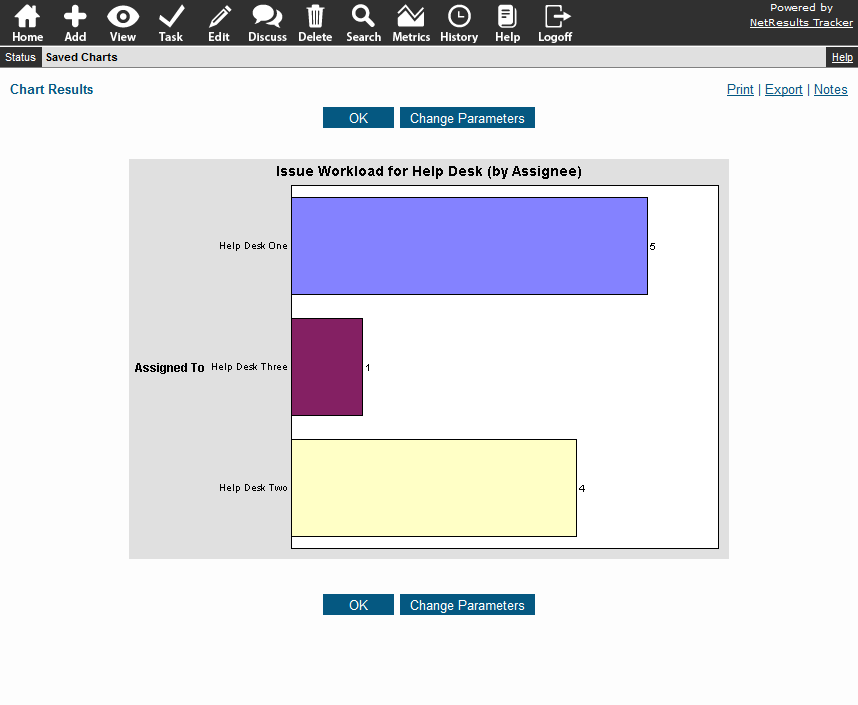
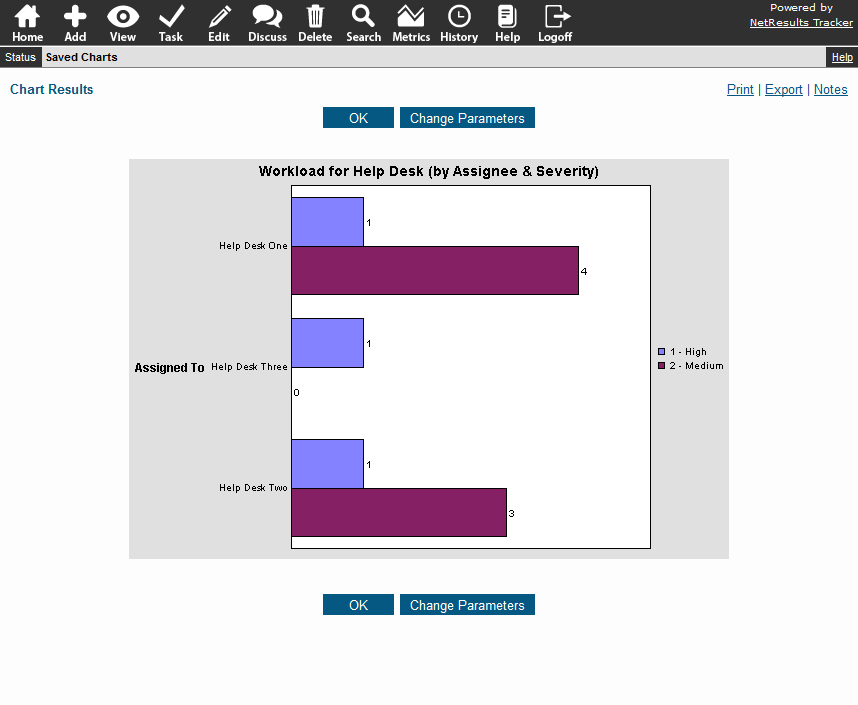
Monitor performance by running reports that compare dates via the Metrics feature.

Chart Comparing Two Dates

Collect Data as Records are Processed

Time stamp date fields at key points of your process. Then, use this data to generate performance metrics. For example, several date fields are configured in the Product Development template included with Tracker:

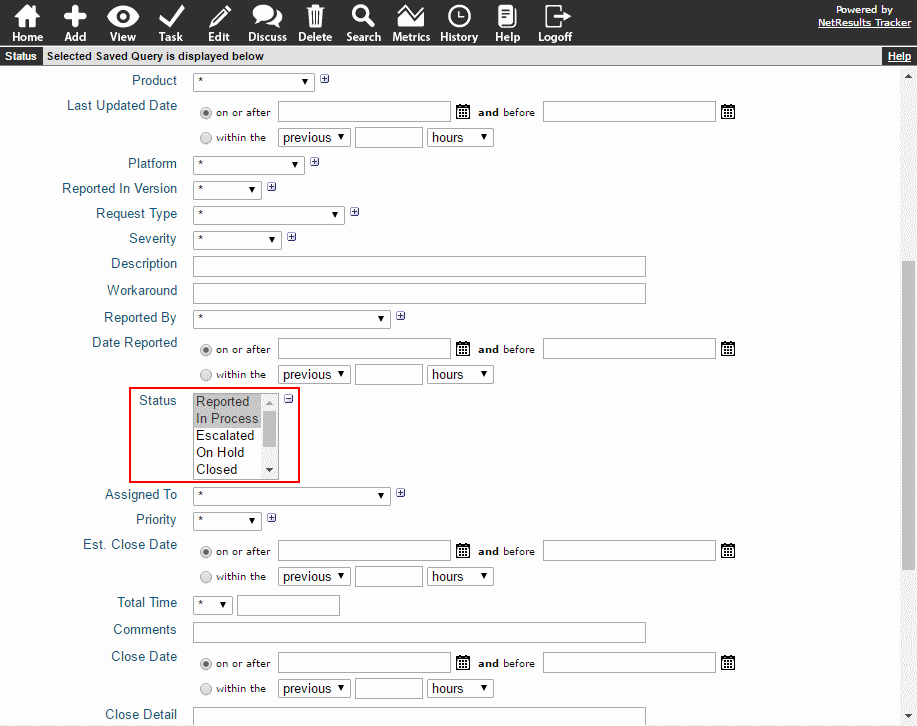
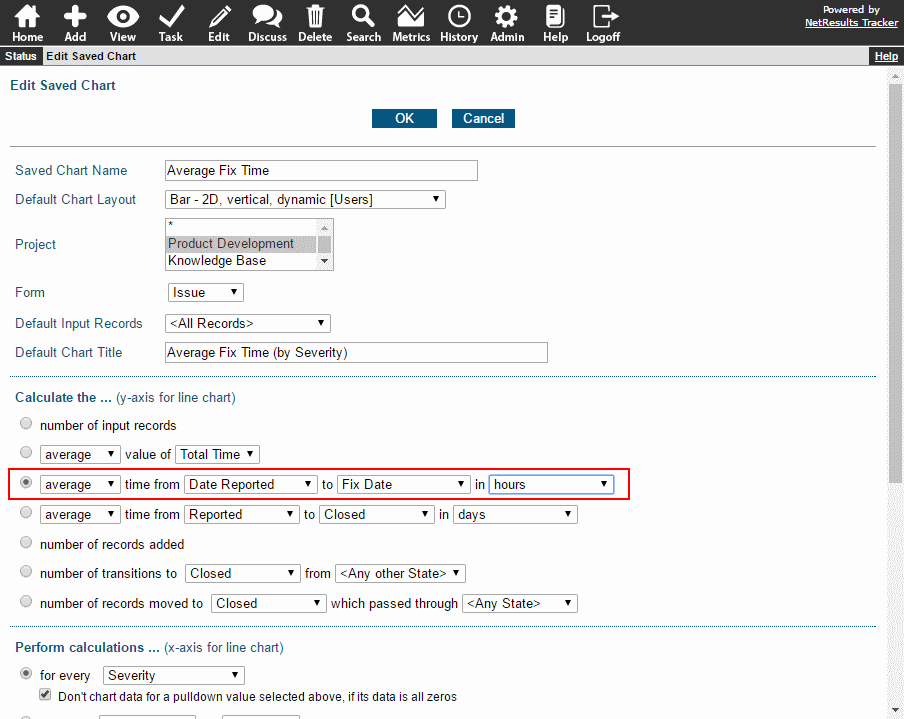
  • Date Reported - notes when an issue was created
  • Fix Date - the date and time an issue was fixed
  • Test Date - documents when the fix was tested

To ensure a date is entered into the field, you can either make the field required, forcing a user 
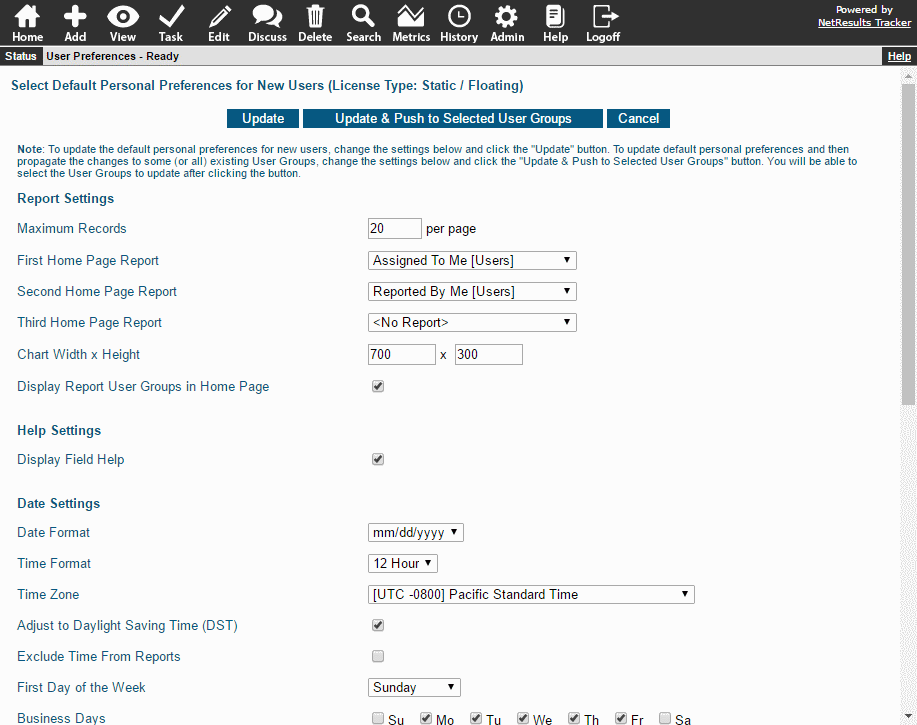
to enter a date, or you can make use of the field's configuration settings to fill in a date automatically.

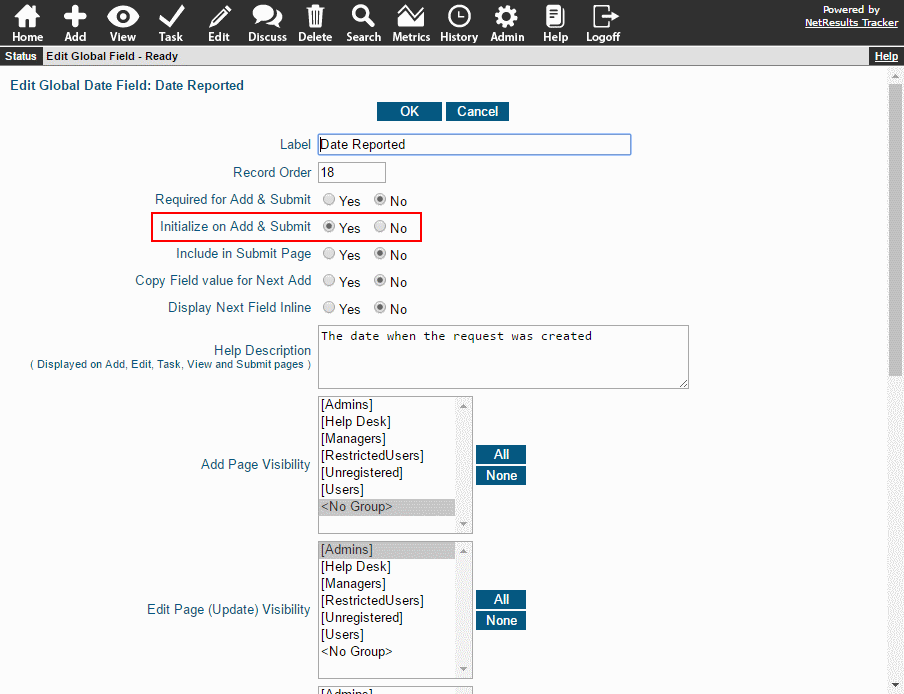
When a Record is Added

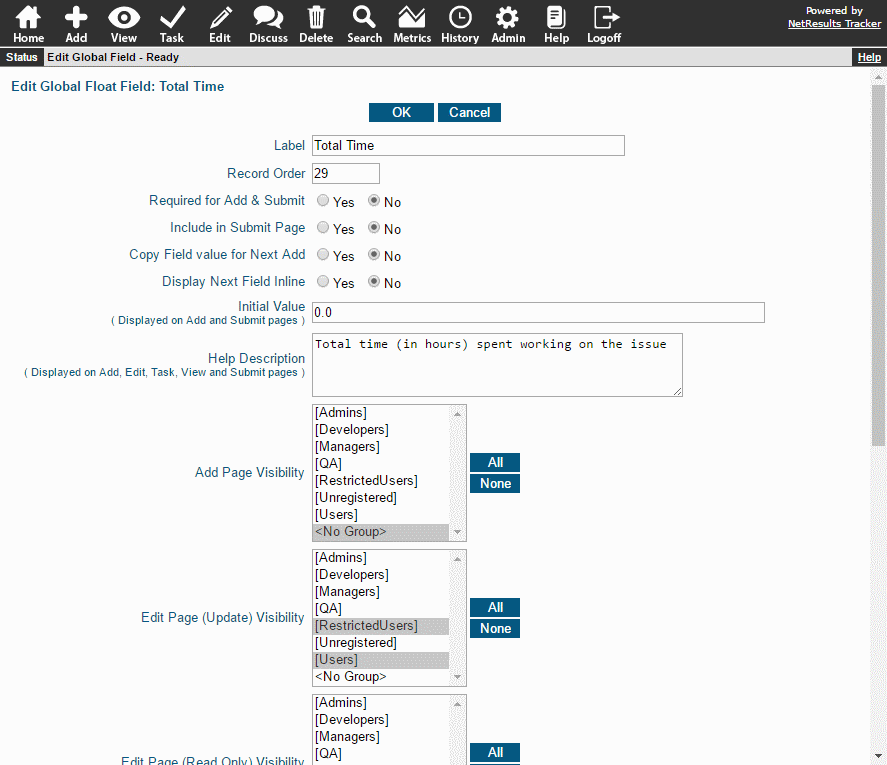
A date can be captured automatically when a record is added by setting the option called Initialize on Add & Submit to "Yes".

Initialize on Add

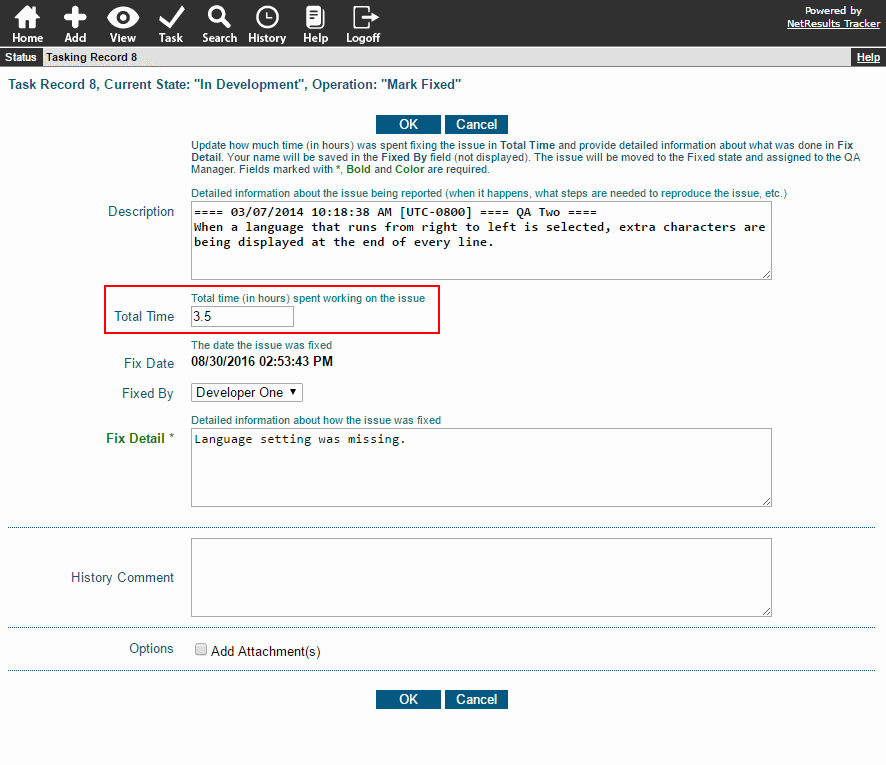
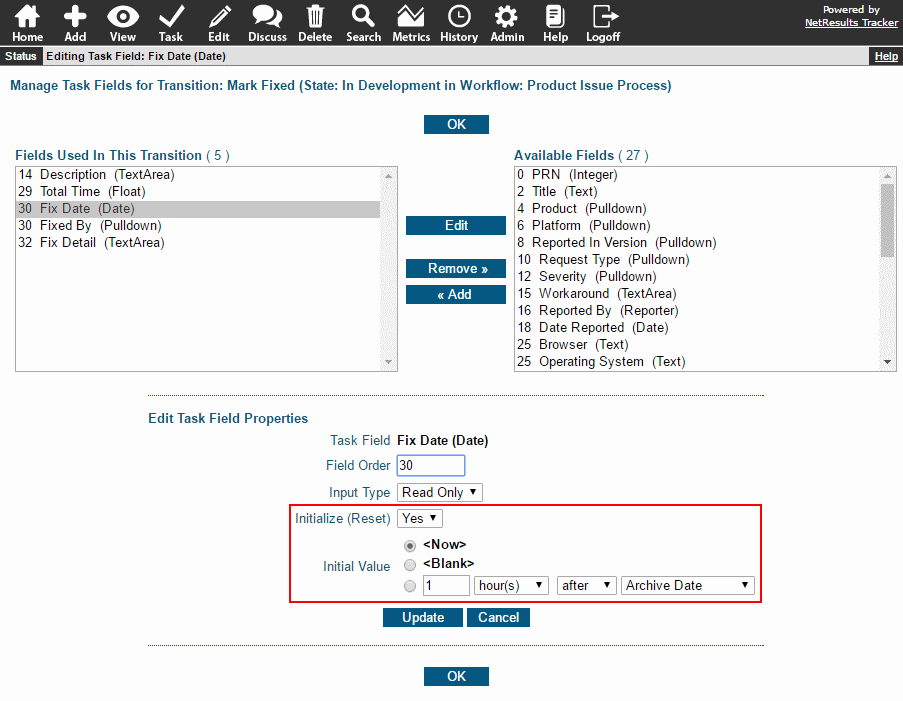
When Records Are Processed Using the Task Operation

A date can be set during the Task operation via the Initialize (Reset) option. Set the Initial Value to <Now>.

Initialize on Task

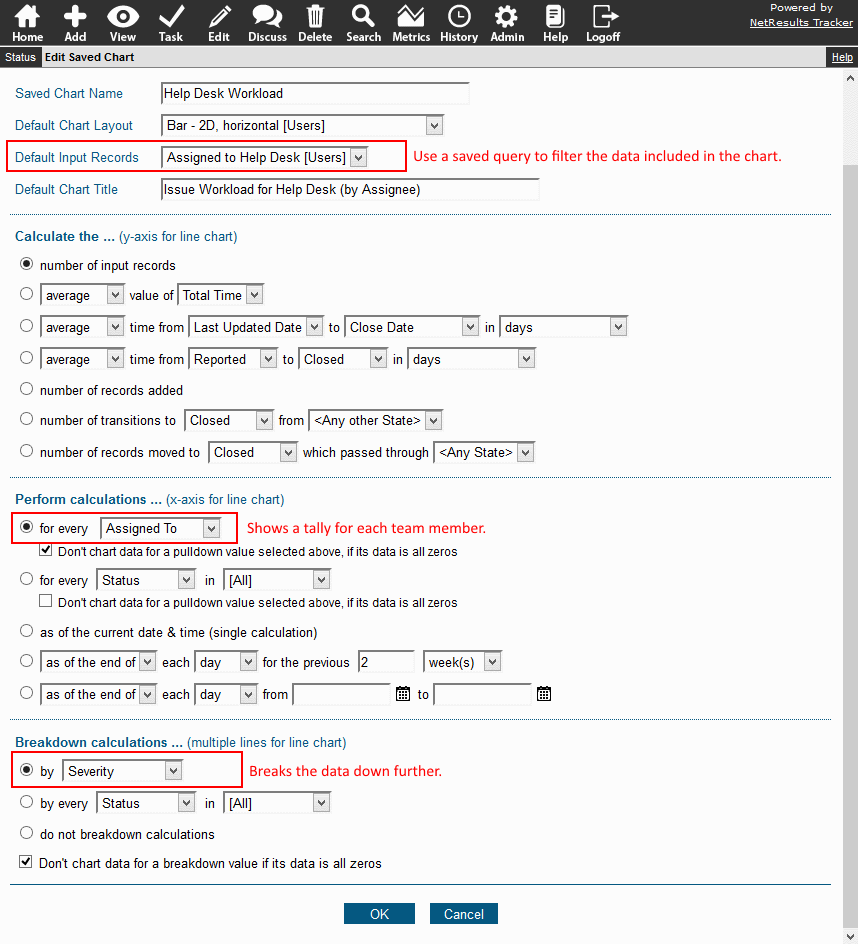
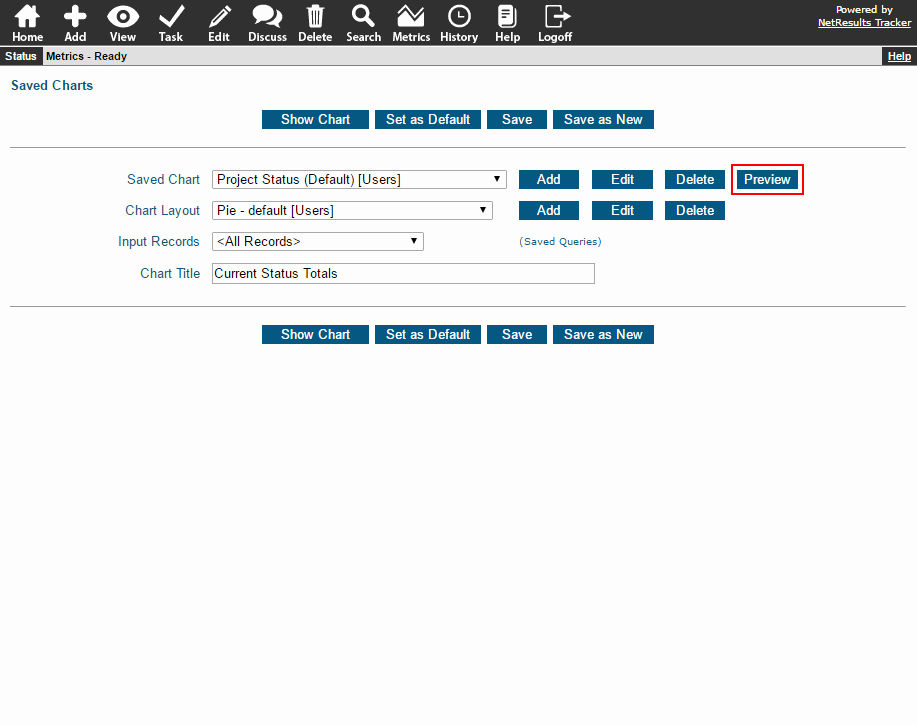
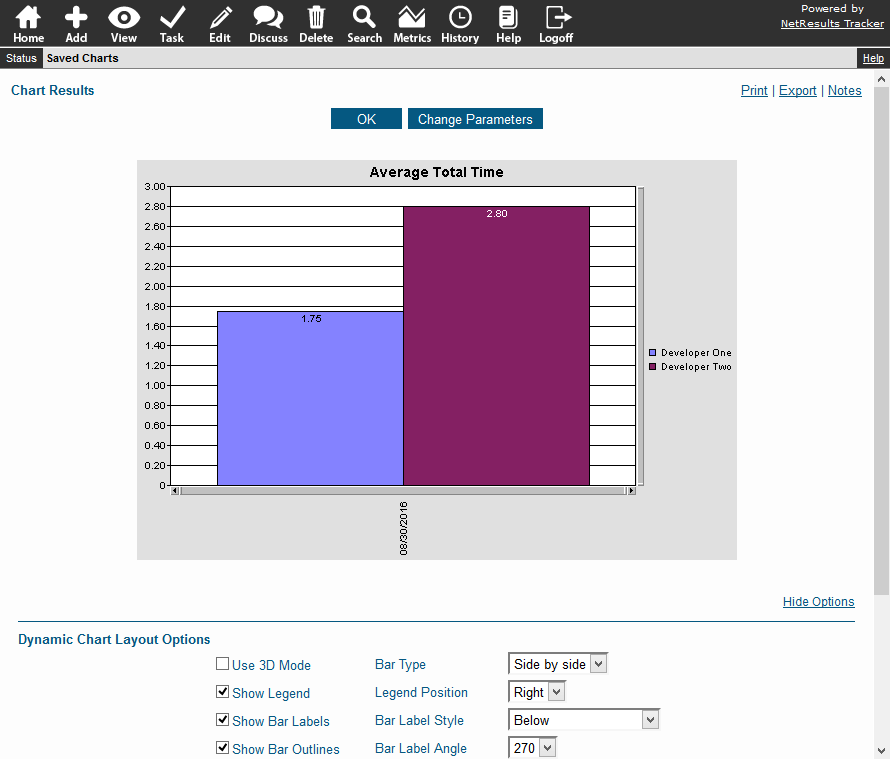
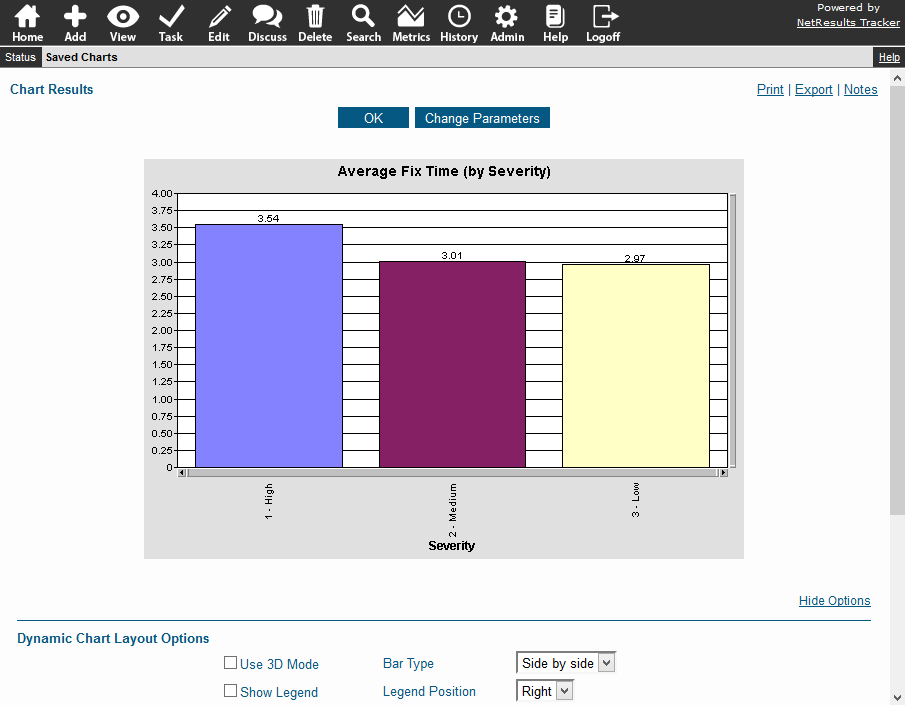
Create Metrics that Compare Date Fields

The Calculate... section of a chart has the option to compare 2 date fields.

Chart option

The Metrics section of the Online Help Guide has more information about creating and running charts.

Change the criteria for a report that's only applied for one run.

Your most used report shows all open tickets. Maybe you'd like to narrow it down to the ones that are Severity 1 for a specific product. You can add these pieces of criteria for one run only and leave your original report intact using the Preview option.

Click on the Search icon and select a saved query in the pulldown at the top. Click on the Preview button to the right.

Preview a Query

The query's criteria will be displayed.

Query Criteria

Make changes to the criteria.

Updated Criteria

Click on the Run Query button to run the report with the changes.

The Preview option is also available when running charts.

Preview a Chart

For more detail, check out the Preview a Query or Preview a Chart information in the Online Help Guide.

When a new user is added to Tracker, the time zone, date settings and reports applied to their account by default are based on what's set in the User Preferences section of the Admin interface.

User Preferences Link

So if you expect to add a number of users from a particular location or area, you can change the time zone and other related settings.

To Check Settings and Change the Defaults

  1. Login as Admin and click on the Admin icon.
  2. Click on the User Preferences link.
  3. Select the user license type: either "Standard/Floating" or "Restricted" and click Continue.

User Preferences for Standard/Floating Users

Information on making changes can be found in the User Preferences section of the Online Help Guide.

Existing Users Can Change Their Preferences

Users that have already been added to the system can change their settings using the Preferences link in the upper right of the Home Page.

Set Personal Preferences

Use a field to track how much time was spent working on an issue.

Perhaps you need to keep track of time spent by your developers or support / help desk engineers for billing purposes. This can be done using a Floating Point or Integer field.

Configure a Float or Int Field

Prompt users to fill in the time they spent when they mark an issue as completed.

Configure the Task Field

You can generate metrics with this data.

Average Fix Time Chart

For more detail on how to create this field, check out the Track Time Spent Knowledge Base article.