Use Metrics to review your process and find steps that can be improved.

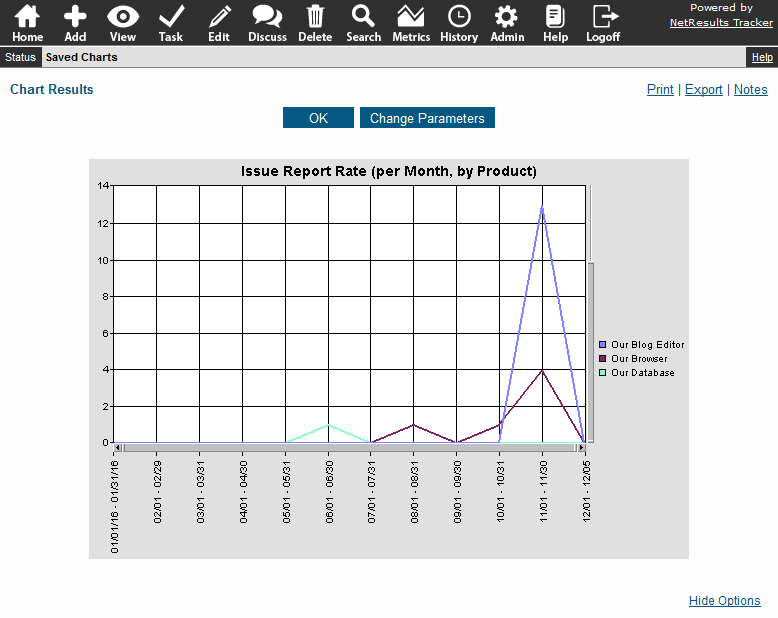
A workflow step that involves testing or approval is an easy place to start. For example, you can run a chart that shows how many fixes have been rejected by QA.

Fixes Rejected By QA

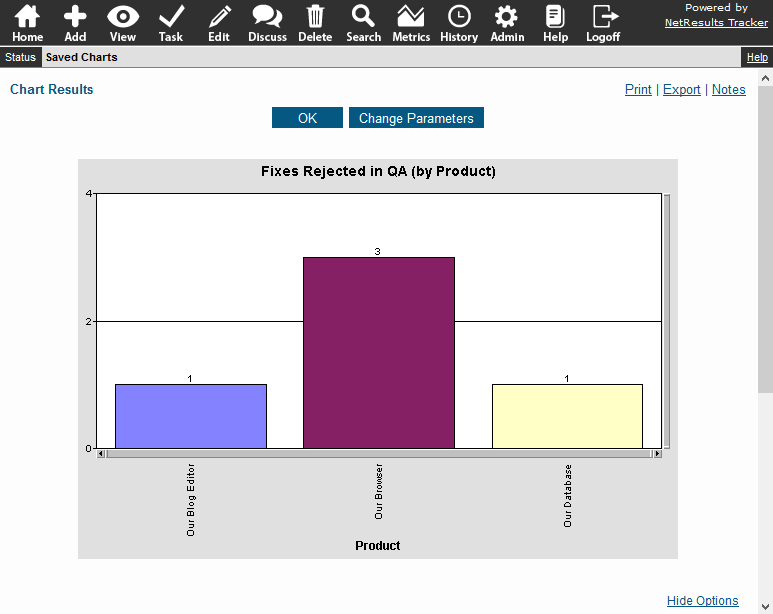
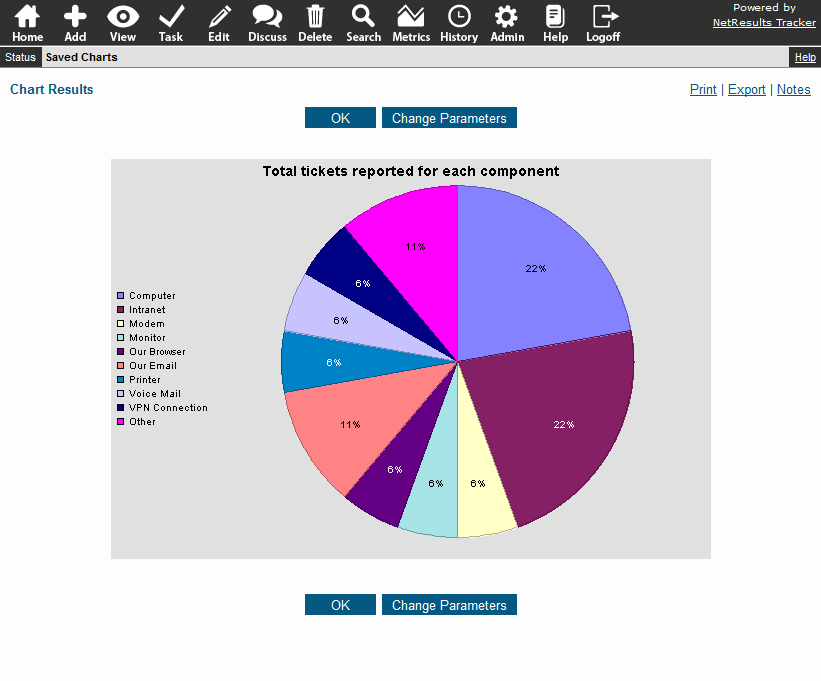
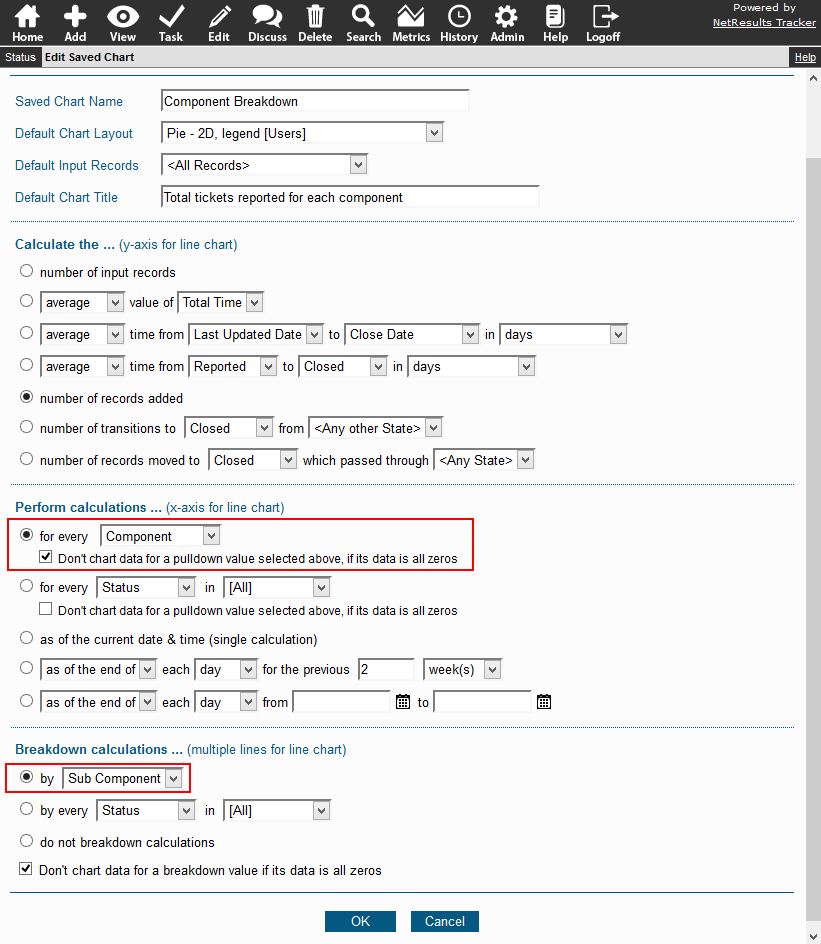
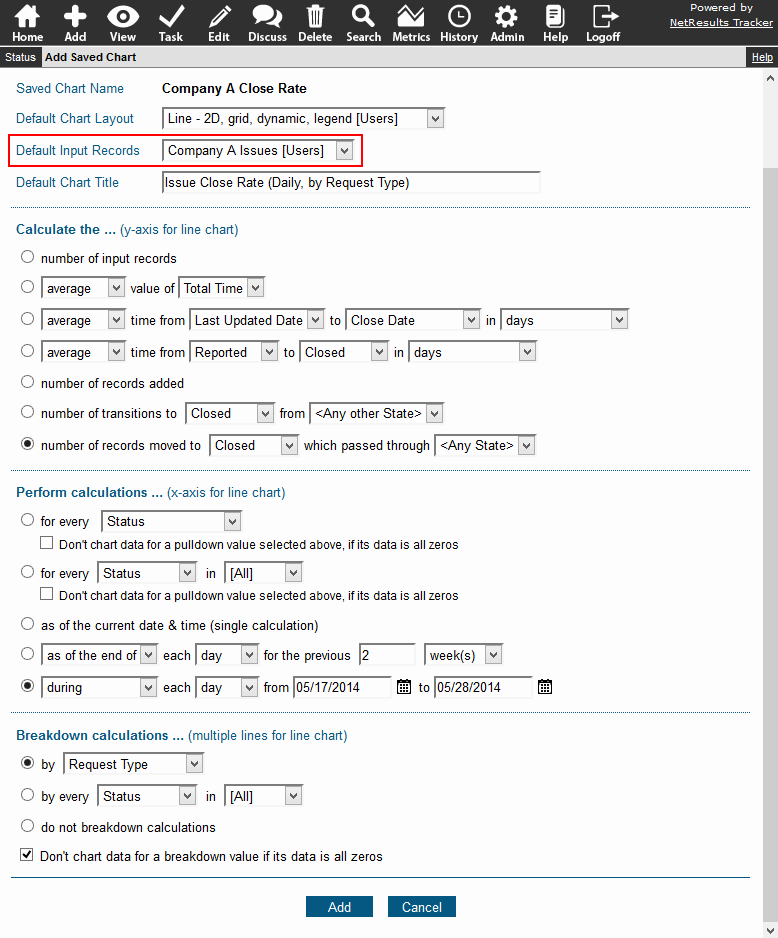
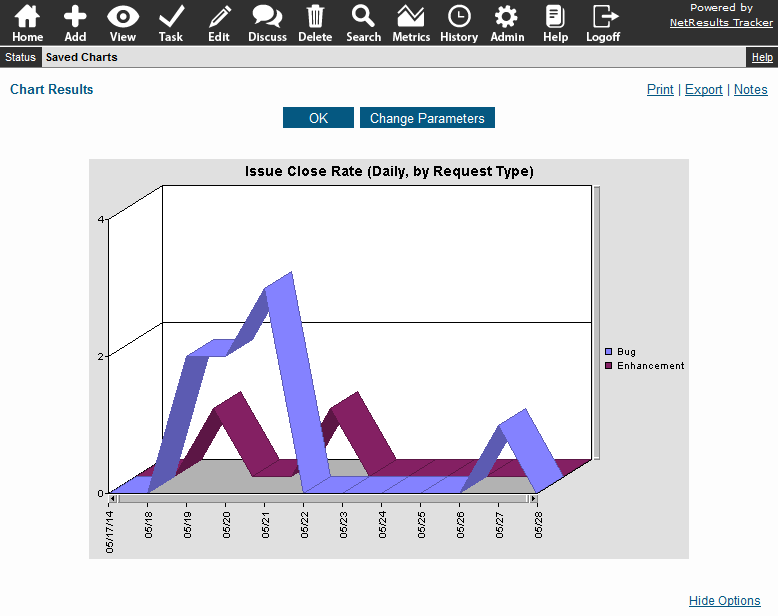
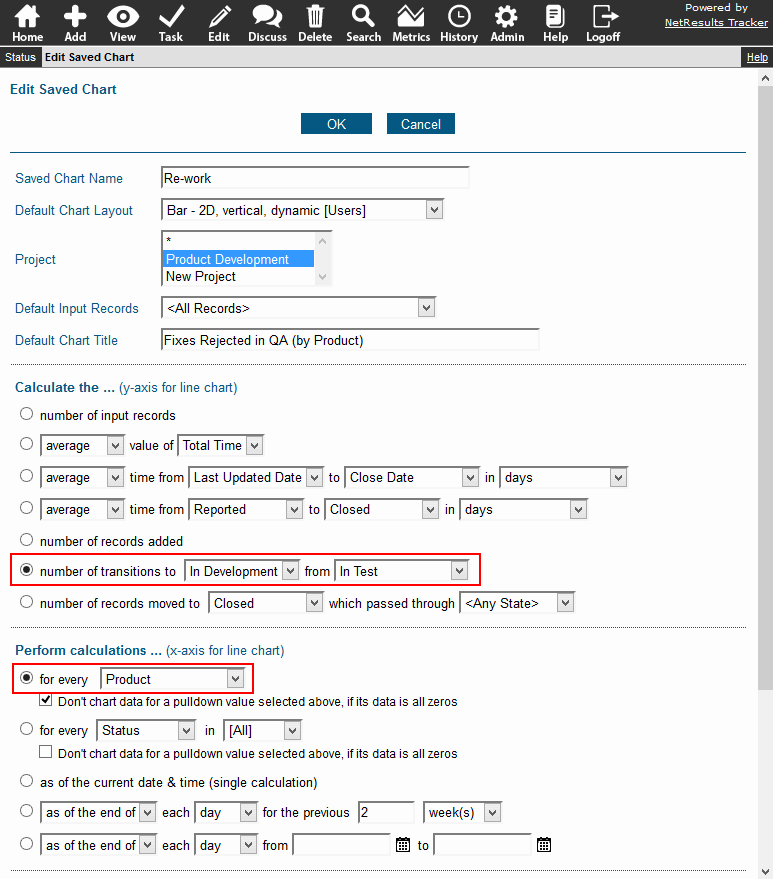
This is done using the chart option that calculates how many records moved from one state to another. You can break the data down by a pulldown as we've done with Product.

Chart Options

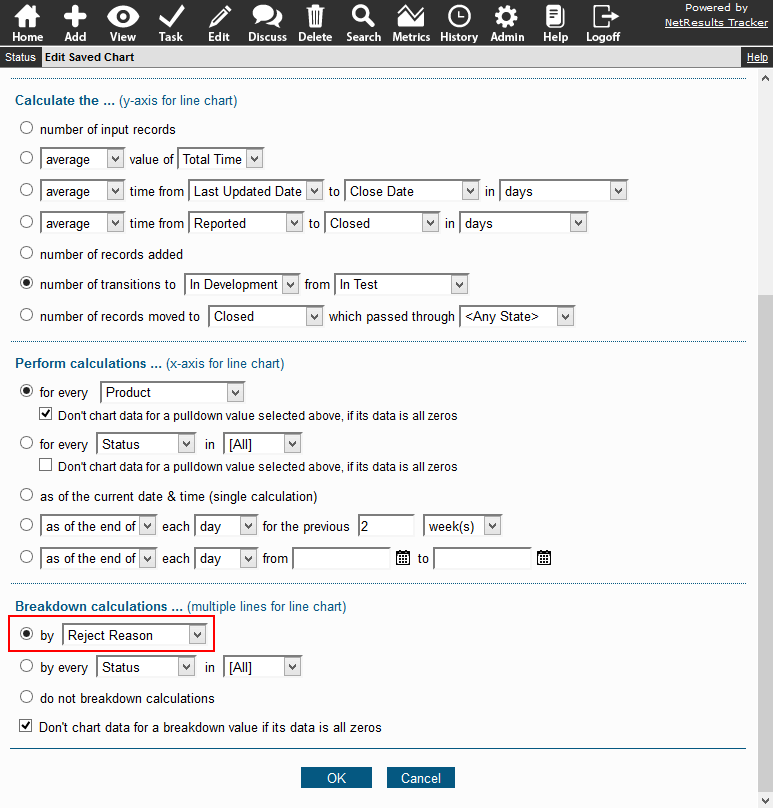
Reviewing the data can help you identify categories or trends. You may find it helpful to create a pulldown field that categorizes the reasons for rejecting a fix so that reports can be run against that criteria. You can use this field to break down the chart data even further.

Reject Reason

Detailed steps for creating a chart can be found in the Online Help Guide.

Run a chart that shows you how many tickets were reported against each component.

Tickets By Component

Charts have the option to show a calculation for each value in a pulldown field. You can even break down the data by a second pulldown like Sub-Component.

Chart Criteria

Steps for saving a chart can be found in the Metrics section of the Online Help Guide.

Build a chart to help you identify trends in your data.

Add Rate by Product

Create a line chart, select the date range and break down the data by a pulldown, if desired.

The sample above shows the monthly rate of issues reported against various products.

Use a Saved Query as a Filter

You can select a saved query that will limit the data included in the chart. The Default Input Records option in the sample below shows we've selected a saved query that will only show tickets reported by Company A in the chart.

Close Rate Parameters

Here's the resulting chart.

Company A Close Rate

Steps for creating a chart can be found in the Metrics section of the Online Help Guide.

A Tracker report is a quick way to set up your product release notes.

Release Notes Report

Add a field for collecting the release notes summary for each issue. Then, make it a task field in the step where an issue is included in a release.

Release Transition

Create a report layout that shows the information you want to include in the release notes.

Release Notes Layout

Save a query that returns the records included in the release. In this sample, we do it with the following criteria:

  • Select the Release Notes report layout so that the results will show the desired fields.
  • Select the product.
  • Select the version of the product being released.
  • Select issues in the Released state.

Release Notes Query

The result: Release Notes made easy.

Release Notes Report

Create intricate queries using AND, OR, NOT and other features available in Advanced Queries.

Advanced queries are useful for combining conditions into a single query. For example, the report below will return support tickets that meet any of the following conditions:

  • Newly added ticket (new tickets are routed to Reported state)
  • Active ticket with Severity 1
  • Escalated ticket

Advanced Query

Options only available in Advanced Queries:

  • OR and NOT conditions
  • Group query phrases using parentheses
  • Ability to search for empty Date, Text or TextArea fields.

Refer to the Advanced Queries section of the Online Help Guide for instructions for creating an advanced saved query.